This is what I gather considering recent posts discussing K=2 here. Seems intuitive yet never so expressed afaik in academe articles and reports. If I have it wrong, all hands please clarify and expand. Thanks.
posted
Come on man. Labeling. That is the game. You should know that. You have been around long enough. Leave that to the youngsters.
There is a reason it is never expressed like that but that is what it is.
Beyoku is correct.
K=2 is African vs PRIMARILY non-African. Nothing is 100%. If you look at K=5 posted by DNATribes recently, about 2 editions ago , even at K=5 the so-called Native American component is also found through out Africa.
K = clusters NOT populations as Swenet pointed out in that thread. Although these clusters can be found more frequently in specific populations.
There is no race.
xyyman Member # 13597
posted
The problem is many authors, not all, assign these clusters within a population as admixture ie movement of people, but ignore the gradient. In fact, it is it deliberate attempt by SOME authors to mislead. And many newbies regurgitate the same lingo back-migration-admixture , when in fact it is drift ie they ignore the gradation as this author points out.
----
Genetic Structure of Human Populations - Noah A. Rosenberg
This overall similarity of human populations is also evident in the geographically widespread nature of most alleles (fig. S1). Of 4199 alleles present more than once in the sample, 46.7% appeared in all major regions represented: Africa, Europe, the Middle East, Central/ South Asia, East Asia, Oceania, and America. Only 7.4% of these 4199 alleles were exclusive to one region; region-specific alleles were usually rare, with a median relative frequency of 1.0% in their region of occurrence (11).
This procedure, implemented in the computer program structure (14), places individuals into K clusters, where K is chosen in advance but can be varied across independent runs of the algorithm. Individuals can have membership in multiple clusters, with membership coefficients summing to 1 across clusters.
In several populations, individuals had partial membership in multiple clusters, with similar membership coefficients for most individuals. THESE POPULATIONS MIGHT REFLECT CONTINUOUS GRADATIONS IN ALLELE FREQUENCIES ACROSS REGIONS ****or *****admixture of neighboring groups.
The CHALLENGE of genetic studies of human history is to use the small amount of genetic differentiation among populations to infer the history of human migrations. Because most alleles are widespread, genetic differences among human populations derive mainly from GRADATIONS IN ALLELE FREQUENCIES rather than from distinctive diagnostic genotypes. Indeed, it was only in the accumulation of small allele-FREQUENCY differences across many loci that population structure was identified. Patterns of modern human population structure discussed here can be used to guide construction of historical models of migration and admixture that will be useful in inferential studies of human genetic history
====
xyyman Member # 13597
posted
It is very simple, it is not rocket science.
There is a gradation of frequency for many of the genotype and corresponding phenotype. Eg SLC24A5 starts at low frequency in South Sahara Africa and increases to the North and reaches peak in Northern Europe.. LP 13910 starts at low frequency in South Sahara Africa and increases to the North and reaches peak in Northern Europe. LP 13915 starts at low frequency in South Sahara Africa and increases to the East reaches peak in Arabia. Africa is the starting point with radiation OUTWARDS for many genotype and phenotype.
That is why autosomal and yDNA and MtDNA must be used in combination to determine direction of admixture .if it exist Henn clearly stated that in her infamous paper.
If you look at Fig 1 at K2 , modern Europeans are primarily African, HA! HA! HA! with Northern Europeans having the least African component and most non-African componenet IN Euroepe but EAst Asians and Americans carry the most "non"African Component although it to is also found in Africa. lol!.
Lazaridis et al is late to the party.
BTW- This is what I was alluding to when I said correct the youngsters in the other thread. If an African population carry 100% African Haplogroup but a fraction of Eurasian AIM how do you explain that? Tic! Toc! The Eurasian SNP is NOT Eurasian.! Taadaaaaa!!! Labels! Labels! Labels!
Djehuti Member # 6698
posted
quote:Originally posted by Tukuler: I have called K=2 African vs Eurasian.
Now I see K=2 is actually African vs OoA
meaning K=2 OoA measure, in STRUCTURE or ADMIX etc analyses, includes African elements that are not EurAsian derived.
This is what I gather considering recent posts discussing K=2 here. Seems intuitive yet never so expressed afaik in academe articles and reports. If I have it wrong, all hands please clarify and expand. Thanks.
Indeed, this is something some folks like the Ultimate Nutcase have to understand.
1. Eurasians descend from OOA.
2. OOA is a subset of East Africans.
3. East Africans further are a subset of continental Africans in general.
There is no 'Hamitic' or 'Caucasoid' race fallacies or lies involved in this dynamic whatsoever. However some folks are apparently just too stupid to understand this
Amun-Ra The Ultimate Member # 20039
posted
quote:Originally posted by Djehuti (corrected):
1. Eurasians descend from OOA.
2. OOA migrants share a common subset with BOTH modern East Africans and West Africans.
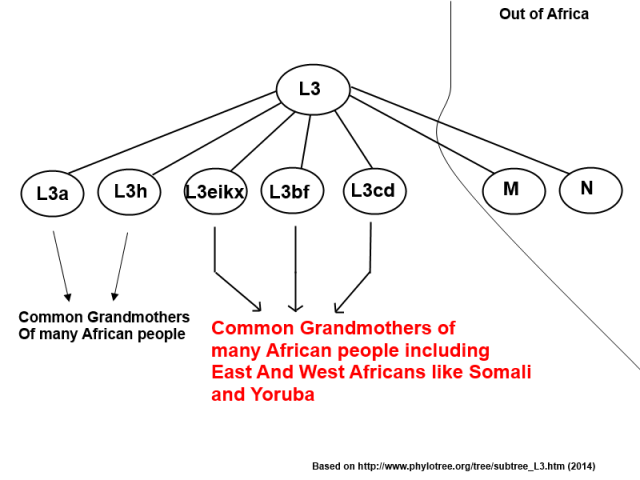
3. Both modern East and West Africans further are a subset of this common CT and L3 subsets.
Corrected that for you.
Amun-Ra The Ultimate Member # 20039
posted
^^^What I said (corrected) above is what is said in those graph below. When you know more than 80% of both modern East and West Africans are descendants of haplogroup E in the graph. And also, later on, haplogroup E-P2.
Tukuler Member # 19944
posted
quote:Originally posted by xyyman: There is a reason it is never expressed like that but that is what it is.
Beyoku is correct.
K=2 is African vs PRIMARILY non-African. Nothing is 100%. If you look at K=5 posted by DNATribes recently, about 2 editions ago , even at K=5 the so-called Native American component is also found through out Africa.
K = clusters NOT populations as Swenet pointed out in that thread. Although these clusters can be found more frequently in specific populations.
As I see it
At K=2 it's African vs OoA and OoA does contain African elements as well as Eurasian. This is why nearly all African ethnic groups at K=2 show some of the color assigned to ethnies far removed from Africa by either geography or biology.
It is only at higher levels of K that Eurasian ancestry may be "guaranteed" in Africans.
I see you failed to learn from the actual manual and userguide I provided K is indeed the number of populations to which the user would assign their data. In this instance you are confusing ethnic groups with K.
I can teach you but I can't force you to learn.
xyyman Member # 13597
posted
ah! forget it....I have more important things to attend to right now.
I agree take the horse to the river, can't make it drink.
continue believing K=number of populations
Tukuler Member # 19944
posted
Yes, I will, thank you.
One "more important" thing to do is go to the professional sources which you obviously didn't do before, so, I now present them again
quote: The user manuals for STRUCTURE and ADMIXTURE only say K is the number of populations, no mention of genetic clusters per se:
Inference of true K (number of populations)
To use ADMIXTURE, you need an input fi le and an idea of K, your belief of the number of ancestral populations.
K is simply * the number of user chosen populations * for a given run of programs * like STRUCTURE, ADMIXTURE, or FRAPPE.
or in Behar's (2010) verbiage
... Bayesian or maximum likelihood (ML) methods share a common principle in which population structure is inferred as differential membership of individuals in specified number (K) of hypothetical ancestral populations (genetic clusters) characterized by ML estimates for allele frequencies at each loci. When a world-wide sample of individuals is analyzed, the assumed number of clusters can correspond to a reference number of distinct divisions, such as continents. Thus individuals can be members of one cluster (e.g. continent) or their genotypes may reflect joint membership in many clusters (e.g. admixture from two or more continents). Because such subdivisions are established geographically or historically, genetic clusters and cluster membership are often discussed in terms of ancestral populations and ancestry admixture proportions.
supplementary note 3
You like somebody's description who's never run either of those programs.
I go with the actual manual and userguide and a professional who has run the program.
What am I supposed to read the whole thread? Yes context is always incisive but is it your opinion in STRUCTURE-like analyses that include Africa that the minority color a large number of Africans show at K=2 (not any other K) is all Eurasian with no African elements at all?
If so wouldn't that mean the OoA peoples had no African genetics or lost them all the second they crossed the Strait or the Sinai?
Help me out here please.
beyoku Member # 14524
posted
I would conceptualize it 2 ways. 1 - a normal k=2 takes the populations as they are know and shows the maximum likelihood SNP's come from 2 populations. This is the here and now. Africans and non African have a cleaner separation.
2 - in the OOA run It would be more accurate to conceptualize these populations in the genetic state they are in now..... But projected back in time 65 to 100 thousand years ago. Things are not so clear cut and there is more of a cline that we would expect. Also if it was 1o's of thousand years in the past ALL AFRICANS including the hunter gatherers would be closer to the "eurasian" group which would really be Africa 2.o. In evolutionary terms there is a date that can be placed on African substructure but we would still have the Eastern OOA groups contributing to other African. Also projected back in time all the non African groups have a higher percentage of non OOA that would have not been lost or differentiated through time.
That is the simplest way I can put it. I would still read that thread though.
Amun-Ra The Ultimate Member # 20039
posted
quote:Originally posted by Tukuler:
If so wouldn't that mean the OoA peoples had no African genetics or lost them all the second they crossed the Strait or the Sinai?
Help me out here please.
You don't seem to have a good basic grasp of population genetics and migrations. Your questions don't make sense, it's like asking why the sky is yellow.
OOA migrants are small groups of people who left Africa lets say 65 000 years ago, only to back migrate to Africa more than 30-40 000 years later.
It's within the 30-40 000+ gaps that OOA migrants/future Eurasians/future non-Africans acquired their distinctive physical features like white skins for Europeans or slanted eyes for East Asians.
So one year after the OOA migrations, the OOA migrants still looked Africans (whatever that meant at that time). It's later on, in the 30-40 000+ years gaps before any kind of back migration into Africa they became distinctive.
Amun-Ra The Ultimate Member # 20039
posted
This shows things graphically in a simple enough manner (It's based on the Pickrell study (2014)):
Here, there's a 65000-3000=62 000 years gaps between the OOA migrations and substantial back migrations of non-African/Eurasians into Eastern Africa.
xyyman Member # 13597
posted
good god!!
Sigh!!
This is very simple. All these software like ADMIXTURE and STRUCTURE do is separate groups of SNP ie clusters using special algorithm. That is all. The technician inputs a hypothetical number of groupings or population eg 2 .which translate to K-2. If he assume 3 groupings/clusters then it become K-3 and so on. The Software separates the imputed genome into clusters or groupings. Thats it. Inferences are then made by the scientists about migration patterns. That is where TreeMix comes in. You quoted this yourself. Good God man! It is clusters which SOMETIMES equates to populations.
---- in Behar's (2010) verbiage
... Bayesian or maximum likelihood (ML) methods share a common principle in which population structure is inferred as differential membership of individuals in specified number (K) of hypothetical ancestral populations (genetic clusters)
----
Think of it like a basket of oranges. And you ask someone to sort the oranges in the basket into 2 groups or clusters. The computer can sort it into big and small oranges or yellow and green. Ie K-2. Which ever is best. You can then take that same basket of oranges and sort them by lets say location grown. So you end up with Florida, California and Dominican oranges ie K-3.
I am not sure what Beyoku is rambling about. Makes me wonder again is he blowing smoke. This is not rocket science.
That goes for you too AMRTU.
xyyman Member # 13597
posted
Sometimes I wonder if I am among my peers. This is not that difficult to understand.
Some of you guys should go back to posting pictures of AEian negroes and arguing over it. Some of us have moved on.
xyyman Member # 13597
posted
So essentially what ADMIXTURE (dont get caught up in the name of the software)is doing lumping all these population from all over the world and separating their genome(SNP) into two groups ie K-2. And Result- Most Africans are similar while most non-Africans are similar. Keep in mind you can also customize the SNP chosen. They can vary from 100,000s to a few hundred. In the Rosenberg data set cited above Europeans are closer to Africans than they are to Asians. These SNPs can be further separated out into 3 clusters(K-3), four cluster K-4 ad infinum.
This is not rocket science.. SMH.
xyyman Member # 13597
posted
The reason I am posting this is for lurkers at least the smarter ones who are interested. II hate seeing newbies get mis-lead because of big egos by veteran posters. if you clowns are at the river and are thirsty .and dont drink. Shrug. I have more important things to post on.
---
Seems like the Hindu is getting it. He gave a relevant and sensible explanation.
Tukuler Member # 19944
posted
@ Beyoku and the forum
composed before Beyoku's latest post
OK lemme follow your Pagani hint. alluding to supplement figure 3
Note that B is not ADMIXTURE K based as was claimed in the K thread. It's EIGENSTRAT PCA based (the 1st and 2nd principle components). Still, comparing the Mbuti K and PCA bars, 100% K1 parallels both African and considerable OOA PCA values.
Eurasian admixture at an ~18% level in Mbuti is unknown to me. This is nearly 1 out of every 6, (eg one great grand parent at mixture event). It must be the African elements in that called Out of Africa not any 'back migrating' elements derived outside the continent proper.
Overall it looks as if at the K=2 level K1's more like 'Stay at home African' and K2 is imprecise in identifying the 'Out migrating African' from 'completely EurAsian derived' 'Out of Africans'.
So to me it is imprecise, even an error, to view K=2 as Africa vs Eurasian tho at higher K's this can be clearly shown.
EDIT: And now that I've read it thank you for helping me out with those two conceptualizations of yours.
Tukuler Member # 19944
posted
@ Xyyman & t/forum
Here, have another bone.
Model-based methods
These methods assume that observations from each cluster are random draws from some parametric model. It attempts to assign individuals to K ancestral populations on the basis of their genotypes, while simultaneously estimating population allele frequencies using maximum-likelihood or Bayesian statistical methods (Pritchard et al., 2000). These methods are implemented in softwares such as STRUCTURE (Pritchard et al., 2000) and ADMIXTURE (Figure 6) (Alexander et al., 2009).
[...] Figure 6. Examples of clustering methods. C) Individual grouping inferred by ADMIXTURE. Results from K = 4 and K = 12 are shown. Each individual's genome is represented by a vertical bar composed of colored sections, where each section represents the proportion of an individual's ancestry derived from one of the K ancestral populations. From (Xing et al., 2010)
[...]
Another clustering method used in this work is ADMIXTURE (Alexander et al., 2009), a model based approach to classify individuals to hypothetical ancestral populations. One problem of ADMIXTURE is that it requires a prior specification of the number of ancestral populations K and there is no effective method to predict the truth K. However, an advantage of ADMIXTURE is that it can identify ancestral components and distances between these components, independent of subsequent admixture events.
Haber (2013) Study of human genetic diversity: inferences on population origin and history DOCTORAL THESIS UPF
More research less hip shots
xyyman Member # 13597
posted
LOL! Whatever you think brotha! Knock yourself out!
I know some of you got it.
Tukuler Member # 19944
posted
That's just what you won't see it's not what I think it's what the professionals both designers and users are telling us laymen the way it is no interpretation involved but you don't have to accept that go ahead make up your own stuff
cluster
cluster of what
putative number of ancestral populations
thats what
nope not rocket science not astrophysics just biology population genetics at that
xyyman Member # 13597
posted
You are on a roll here! Dont stop now!
--- Quote: Putative number of ancestral populations ---
Dont blame me ..blame your parents.
beyoku Member # 14524
posted
quote:Originally posted by Tukuler:
Overall it looks as if at the K=2 level K1's more like 'Stay at home African' and K2 is imprecise in identifying the 'Out migrating African' from 'completely EurAsian derived' 'Out of Africans'.
So to me it is imprecise, even an error, to view K=2 as Africa vs Eurasian tho at higher K's this can be clearly shown.
This. That is why I said it needs to be conceptualized through time. When you put a date on OOA via L3/M168 we arrive at about 60-65 thousand years. When we put a date on the separation of Africans and "Non Africans or East And West Africans through autosomal SNP we get dates that PRECEDE 60-65 thousand years so we are basically looking at African substructure that uniaprentals cannot account for as they were not even around. SO in reality OOA vs A would looks somewhat like it does in the image.....most Africans would be a composite of BOTH groups. Or mutiple unknown groups prior to the exodus of humans out of the continent.
As far as the K - you can tell the computer how ever many K's you want. The computer can "suggest" and optimal K......You can even designate certain populations as a K and then run the analysis. That said, the data that the computer will generate may not be informative of populations structure that we recognize or that of which can be constructed by historical events.
xyyman Member # 13597
posted
Nice! much better! Clean that up. Ignoring the dating nonsense. I am not sure they can date SNP as yet as with Haplogroups. The molecular clock/mutation rate hasnt been defined for SNPs. Why? Because they havent standardized on what SNP/AIM to use as a baseline. As I said they can use 100,000s to a few hundred. Not all dataset is the same.
That said. I am glad to see you have come around and have a better understanding.
quote:Originally posted by beyoku: [] [] xxxxxx xxxx so we are basically looking at African substructure that uniaprentals cannot account for as they were not even around. SO in reality OOA vs A would looks somewhat like it does in the image.....most Africans would be a composite of BOTH groups. Or mutiple unknown groups prior to the exodus of humans out of the continent.
As far as the K - you can tell the computer how ever many K's you want. The computer can "suggest" and optimal K......You can even designate certain populations as a K and then run the analysis. That said, the data that the computer will generate may not be informative of populations structure that we recognize or that of which can be constructed by historical events. [/QB]
That is when the BS starts.....connecting the observed structure to historical events. Finally!
xyyman Member # 13597
posted
Now you understand what Rosenberg meant cited above-
Quote: The CHALLENGE of genetic studies of human history is to use the small amount of genetic differentiation among populations to infer the history of human migrations. Because most alleles are widespread, genetic differences among human populations derive mainly from GRADATIONS IN ALLELE FREQUENCIES rather than from distinctive diagnostic genotypes. Indeed, it was only in the accumulation of small allele-FREQUENCY differences across many loci that population structure was identified. [b]Patterns of modern human population structure discussed here CAN be used to guide construction of historical models of migration and admixture that will be useful in INFERENTIAL studies of human GENETIC HISTORY
---
I hate talking down at people. DJ seem to get it now Beyoku is catching on. AMRTU you have a ways to go man, get out of the idea that AEians are ALL stereotypical Negroes. They are NOT. That view is stunting your development.
AEians are, yes, indigenous Africans. Horners and Berbers are also pure Africans
beyoku Member # 14524
posted
They can date some SNP's Think of the dating of the SNP for SKin tone, eye color or Lactose Persistence. BTW "Haplogroups" are combinations of SNP's.....and those are dated. We also have the SNP variation that they are pulling from ancient DNA. This data is then tied in with Carbon dating.
xyyman Member # 13597
posted
You are partly right.
Yes. Haplogroups is a combination of SNPs. And, yes, genes for eye color and skin tones etc also contain SNP. But they are standardize ie agreed upon ie known genes ie know locations.
AIM/SNP are genome wide and NOT standardize. As you said, the computer software just randomly group/cluster SNPs. That is why they are still working on reducing AIM/SNP so it can be used in forensic. It is not there yet. That is why they still use STR in forensic ie population identification.
In the Rosenberg study(see above) they used only 4199 locations. But in other studies they can use as much as 700,000 locations/SNPs. That there is the problem.
xyyman Member # 13597
posted
According to Rosenberg, that is what Pickerell et al, Pagani et al and AMRTU et al is trying to do. Infer human migration by small amount of genetic differentiation. Some authors observe this differentiation and develop mathematical models to determine back-migration. That is what Henn tried to do in her infamous paper. In her studies she observed two things
1. SNPs similarity between North Africans and Qataris 2. Through mathematical manipulation she observed a bottleneck in North Africans. She did NOT observe this or at least not mention observing it in Qataris
Now, based upon well published information about OOA Bottle Neck she equated her observed North African Bottle Neck with the work published by others on OOA Bottle Neck. She INFERRED they are one and the same Bottle Neck thus back-migration. That was sloppy work. If I was her professor she would have gotten a C- grade. But that is the game played. Many of you newbies dont get it. You regurgitate parts of the study without fully understanding it.
xyyman Member # 13597
posted
Oh! Henn had a get out of jail free card included in her work. Most authors have it. She said to confirm her back-migration theory genomic sequences (ie Haplogroup or STRs)must be done. Yes, you heard me, Haplogroups. Now isnt that a bitch. That way you cant pin them to a corner.
The reputable researchers like Henn will include the get out of jail. That way, you can't say they fugked up. I have fun reading paper and trying to find it. You should try it. You know. Test you mettle.
You have a lot to learn my man.
Djehuti Member # 6698
posted
quote:Originally posted by Amahnutcase The Ultimate:
quote:Originally posted by Djehuti (corrected):
1. Eurasians descend from OOA.
2. OOA migrants share a common subset with BOTH modern East Africans and West Africans.
3. Both modern East and West Africans further are a subset of this common CT and L3 subsets.
Corrected that for you.
Putting your erroneous words into my post is NOT correcting anything! Also what your write makes no sense. What is meant by "sharing a common subset"?! LOL
What I wrote was already correct:
1. Eurasians descend from OOA.
2. OOA is a subset of East Africans.
3. East Africans further are a subset of continental Africans in general.
Even the diagram you constantly spam supports what I originally wrote, you idiot!
Modern YAP derived, PN2 derived Africans and modern YAP derived Eurasians are closer related than either are to CF derived Eurasians and both YAP derived Africans in general are closer related to CF derived Eurasians than either is to Africans of much older clades such as A and B.
These scientific FACTS annihilates the old concepts of typological 'race'. And that includes "Caucasoid" as well as "Negroid".
Tukuler Member # 19944
posted
quote:Originally posted by xyyman: You are on a roll here! Dont stop now!
--- Quote: Putative number of ancestral populations ---
Dont blame me ..blame your parents.
Look, fair warning. This is not your ghetto back street and references to mine or anybody else's parents will not be tolerated.
Don't try me.
In my culture parents are highly respected.
I expect an apology.
BlessedbyHorus Member # 22000
posted
quote:Originally posted by Tukuler: I have called K=2 African vs Eurasian.
Now I see K=2 is actually African vs OoA
meaning K=2 OoA measure, in STRUCTURE or ADMIX etc analyses, includes African elements that are not EurAsian derived.
This is what I gather considering recent posts discussing K=2 here. Seems intuitive yet never so expressed afaik in academe articles and reports. If I have it wrong, all hands please clarify and expand. Thanks.
I believe you're right on the money.
Tukuler Member # 19944
posted
@ Beyoku & forum
Haven't fully digested your latest but from skimming it
Looks like you may have experience in actually running STRUCTURE ADMIXTURE etc.?
I gathered from Botigue2013 that the user determined which iteration and which K is "optimal" not by default but by calculating cross validation errors.
Botigue is the only biologist where I've seen published run after run so we could see a little behind the scene action. See her Fig. S1
xyyman Member # 13597
posted
No disrespect to your parents intended. In context. Intellignece is somewhat inherited.
My apologies about the parent statement.
But my point is unchanged. If you cannot understand...well ....shrugs...keep reading.
quote:Originally posted by Tukuler:
quote:Originally posted by xyyman: You are on a roll here! Dont stop now!
--- Quote: Putative number of ancestral populations ---
Dont blame me ..blame your parents.
Look, fair warning. This is not your ghetto back street and references to mine or anybody else's parents will not be tolerated.
Don't try me.
In my culture parents are highly respected.
I expect an apology.
xyyman Member # 13597
posted
Parole. YH?
He asked a question, giving TWO possible options.
And your response is what?....both are correct? HA! Ha!
quote:Originally posted by BlessedbyHorus:
quote:Originally posted by Tukuler: I have called K=2 African vs Eurasian.
Now I see K=2 is actually African vs OoA
meaning K=2 OoA measure, in STRUCTURE or ADMIX etc analyses, includes African elements that are not EurAsian derived.
This is what I gather considering recent posts discussing K=2 here. Seems intuitive yet never so expressed afaik in academe articles and reports. If I have it wrong, all hands please clarify and expand. Thanks.
I believe you're right on the money.
Ardo Member # 1797
posted
Nah, full pardon, case dismissed.
I understand your point
I don't agree
as you don't agree to my point
fair enough
in brainstorming sessions no idea is thrown away until later after a working set of them has been presented then they get whittled down to the best few effective solutions which are presented to the client for final approval between them
thing is ES has no client hence no final approval
xyyman Member # 13597
posted
As an example: As I said there lies the problem. Selecting and reducing the number of SNPs for AIM.
------- Ancestry informative markers for fine-scale individual assignment to worldwide populations
Abstract Background and aims The analysis of large-scale genetic data from thousands of individuals has revealed the fact that subtle population genetic structure can be detected at levels that were previously unimaginable. Using the Human Genome Diversity Panel as reference (51 populations - 650,000 SNPs), this works describes a systematic evaluation of the resolution that can be achieved for the inference of genetic ancestry, even when small panels of genetic markers are used.
Methods and results A comprehensive investigation of human population structure around the world is undertaken by leveraging the power of Principal Components Analysis (PCA). The problem is dissected into hierarchical steps and a decision tree for the prediction of individual ancestry is proposed. A complete leave-one-out validation experiment demonstrates that, using all available SNPs, assignment of individuals to their self-reported populations of origin is essentially perfect. Ancestry informative genetic markers are selected using two different metrics (In and correlation with PCA scores). A thorough cross-validation experiment indicates that, in most cases here, the number of SNPs needed for ancestry inference can be successfully reduced to less than 0.1% of the original 650,000 while retaining close to 100% accuracy. This reduction can be achieved using a novel clustering-based redundancy removal algorithm that is also introduced here. Finally, the applicability of our suggested SNP panels is tested on HapMap Phase 3 populations. C
onclusion The proposed methods and ancestry informative marker panels, in combination with the increasingly more comprehensive databases of human genetic variation, open new horizons in a variety of fields, ranging from the study of human evolution and population history, to medical genetics and forensics.

 posted

![[Roll Eyes]](rolleyes.gif)
