Out-of-Africa, the peopling of continents and islands: tracing uniparental gene trees Stephen Oppenheimer
Abstract
Genetic relationships between human groups were first studied by comparisons of relative allele frequency at multiple loci. Geographical study of detailed, highly resolved trees of single, non-recombining uniparental loci (mitochondrial DNA: mtDNA and Y chromosome/non-recombining Y: NRY), following specific lineages rather than populations, then revolutionized knowledge of the peopling of the world, although, curiously, the use of geographically highly specific mutations that protect against malaria, found on individual autosomal globin genes, were first in single-locus phylogeography. mtDNA, with its high single nucleotide polymorphism (SNP) mutation rates and relative ease of dating, led the way and gave stronger proof of the recent near replacement of all human species by anatomically modern humans (AMH). AMH left Africa via a single southern exit about 70 000 years ago and rapidly spread around the Indian Ocean towards the Antipodes, long before a small branch left a South Asian colony, earlier on the trail, to populate Europe. The worldwide skeleton phylogeny of mtDNA is fully resolved, but a regional analysis will continue to illuminate subsequent migrations. NRY with a lower SNP mutation rate still has a dating problem relating to use the of single tandem repeats (STRs), but has validated mtDNA results and with more geographical specificity and genomic size, as with the autosomal human genome, has much more detail to offer for the future.1. Introduction
Genetic relationships between human groups were first studied by comparisons of relative allele frequencies at multiple loci. This population-based approach had problems of resolution and dating, but results were largely consistent with an African ancestry for anatomically modern humans (AMH). The lineage-based approachwhich involved phylogeographic analysis of uniparental non-recombining DNA, based on regionally specific, highly detailed, reconstructed gene treeshas illuminated detailed geography of migrationsin particular, the exit route of AMH from Africa. It should be recalled that the use of geographically highly specific mutations on single-locus phylogenies, to trace migrations, started with autosomesfor instance, the alpha- and beta-globin loci.
Following the discovery of a high rate of α+ (single deletion) thalassaemia in the Pacific [1], protecting against and selected for by malaria [15], specific deletional variants were shown to link Melanesia to Polynesia [6], tracing an ancient, staged migration that was only recently fully elucidated using mitochondrial DNA (mtDNA) [7]. Samples collected in the early 1980s for these studies, by this author and others, were used to construct a worldwide beta-globin locus phylogeny, based on population genetic distance analysis of restriction fragment length polymorphism (RFLP) haplotypes, which unambiguously resolved Africans as the deepest single ancestral branch from which all non-African groups arise [8], just scooping the famous mitochondrial Eve paper [9] by one year.
The finding of a greater genetic diversity within Africa, when compared with outside, is now abundantly supported by many genetic markers; so Africa is the most likely geographical origin for a modern human dispersal. There still are, however, four basic questions essential in any reconstruction of the African Exodus, in the following logical order: first, how many founding exits of AMH can be seen in the fossil or archaeological record? Second, which of these are evidenced genetically by continuity into modern regional populations (rather than by evanescent interglacial spreads with other fauna in the fossil record)? Third and fourth, which route(s) were taken and when? Two further questions ride on these last: how and why?
Previous Section Next Section 2. Regional setting
In geographical terms, there is a growing consensus on a single southern dispersal of AMH extending from Africa via the mouth of the Red Sea moving around the coasts of the Indian Ocean initially to Bali, but ultimately to Melanesia and Australia in the southwest Pacific, and to the Americas on the other side (figure 1). The argument for the single exit [11,12] rather than multiple exits [13,14] is mainly based on the finding of single lineages, initially mtDNA and the Y chromosome non-recombining region (NRY), but now shown in the X chromosome and some autosomes, representing the entire non-African genetic diversity [15]. Recent claims for extra AMH exits at the Eemian interglacial [1618] need to be viewed in this context.
_________________________ The concept that modern human range extension out of Africa proceeded initially along coastlines has depended largely on the rapidity of this movement, as inferred from genetic phylogeography, because only three key founder mtDNA haplotypes (M, N and R) give rise to multiple regionally specific branches en route, in effect, three regional starbursts, found all the way from Arabia to Bali (e.g. fig. 6 in Soares et al. [7]). For this to be possible, these explorers must have been able to exploit coastal marine resources. Shellfishing, starting from at least 160 000 years ago (reviewed by McBrearty & Stringer [19]), was limited to the intertidal zone, and would be over-exploited, necessitating continuous extension along the beach. This beachcombing model provides an immediate and continuous motive for unidirectional, linear migration. Evidence of marine exploitation is found at the very earliest occupation sites in Australia and most significantly at the Australian threshold dating to greater than 42 ka cal. BP in Jerimalai in East Timor [20].
Previous Section Next Section 3. Material and methods used in review of genetic phylogeography
(a) Phylogeography The approach of genetic phylogeography (literally and graphically referring to laying the gene tree on the mapfor a description of the method of founder analysis, see Richards et al. [21]) is particularly useful for answering topographic questions of migration and route but, although used extensively for dating migrations, has less precision for that purpose. Conversely, the disciplines of archaeology, palaeoanthropology and the earth sciences, including palaeoclimatology, are most useful for testing dating regimes and routes suggested by the genetic models. A combined approach should give increased confidence by triangulation. The study of the geographical spread of gene lines uses three related types of inference: first, a gene tree (figure 2) is built up by mutations in the same stretch of DNA as branch points (preferably non-recombining, e.g. mtDNA and NRY [11,15,22]), from representative population samples. Such trees, if based on non-recombining DNA, are unambiguous and possess great topographic detail and geographical specificity. Second, migrations are inferred, based on the geographical distribution of individual gene branches. Third, the diversity of clusters of gene lines is used to infer time depth of individual branches. These three forms of phylogeographic inference are combined in founder analysis, which is the identification and dating of specific founder lines moving from a source to a target region. A common misunderstanding of dating the arrival of founder lineages in a new region is that carried-over diversity is dated as well, thus giving a falsely older date. On the contrary, founder analysis formally excludes such errors by making a detailed comparison with source populations, thus using only estimates of founding dates on the basis of unique new diversity arising at the target [21].
(b) Complete sequence data: sources, phylogeny, calibration and dating method Dating of genetic phylogenies and founding events has been central to such discussions of models of human migration, and some form of calibration is essential. Most archaeological and genetic models estimate the exit of AMH from Africa at well over 40 ka, thus outside the limits of most carbon dating. There is still rearguard dispute over the accuracy and precision of luminescence studies, which offer to extend geological dating of human activity much further back. The great Toba volcanic eruption in Sumatra (which is very accurately dated at 74 ka), which left its ash-mark around the Indian Ocean and even in the Greenland Icecap, has offered an alternative and tempting older date marker to archaeologists and geneticists and still does. Genetic dating, if not in its infancy, has only really been of value for less than 30 years and has advanced most for the mitochondrial locus. Formerly, the short hypervariable regions (HVS12) of the mtDNA genome offered a large amount of information for relatively little sequencing and, being non-coding, avoided issues of selection. HVS1 sequences still represent over 95 per cent of published mtDNA data and, when combined with key RFLP sites, still give good phylogenetic resolution and phylogeographic information. However, some lack of resolution and network reticulation, owing to homoplasy, still hampers detailed worldwide and regional phylogeography and has raised questions over dating precision. Since the first 52 complete sequences (CS)-mtDNA) were published in 2000 [23], increasingly, CS-mtDNA data with far greater individual sequence information and less overall homoplasy have addressed these gaps [7].
In a review on out-of-Africa by Oppenheimer [12], all available CS-mtDNA data for South Asia, southeast Asia and Sahul were collected in order to estimate relative regional founding dates, using a CS-mtDNA calibration that best approximated the L3 date from the contemporary, most widely used, coding region methods at 83 ka [24,25].
The dates of the relevant non-African lineages, estimated by this method, were interpreted to favour a successful pre-Toba exit by AMH, with the suggestion of a partial extinction bottleneck in India resulting from the Toba event itself [12], but caution was expressed on giving a conclusion either way (i.e. pre- or post-Toba), because of not only the wide error bars on these estimates, which included the date of Toba, but also the questions already hanging over calibration and linearity [26] of the mtDNA clock. The concluding opinion was open: that only accurately dated AMH fossils, found in the appropriate context, could ultimately resolve the Toba issue.
A number of issues have recently been raised over calibration of the mtDNA molecular clock [27,28]. These include (i) uncertainty over the humanchimpanzee fossil split estimates, in terms of both their reliability for calibration and also the mutation rate variation over such long periods, when compared with more recent demographic and geological events within the timescale of AMH colonization of the world; (ii) rate variation in different sectors of the mtDNA molecule; (iii) factors such as the effect of serial, and regionally specific population bottlenecks on calculation of the important Rho statistic used previously in most estimates; (iv) the most important of these concerns: proven nonlinearity, due to both homoplasy, particularly in hypervariable non-coding regions, and gradual purifying selection of non-lethal non-synonymous mutations in the coding regions. Luckily, these nonlinearity effects are regular, predictable and measurable, and can be largely corrected for mathematically, improving precision and linearity, but not of course addressing the direct calibration issues.
A recalibration paper [7] was published in 2009, subsequent to the above-mentioned review [12], using a worldwide phylogeny of greater than 2000 complete mtDNA sequences to measure, predict and correct for nonlinearity effects, calibrating on a chimpanzeehuman split of 6.5 Ma. Of the above-mentioned methodological issues, (i) was partially addressed by cross-checking on recent archaeological founder events, (ii) and (iv) were more directly addressed, whereas (iii) was partially addressed by citing age estimates using several different methods (Rho estimation and maximum-likelihood estimates) and making multiple interregional and chronological cross-comparisons.
This author, as a co-worker on that paper, argues that this is now the most accurate and precise human genetic clock calibration available, until another replaces it. An alternative method of calibration was published in 2008, based on the diversity of the Q haplogroup (unique to Melanesia) and a carbon-based colonization date of 45 ka, which produced very similar ages for L3 (6186 ka), M (5369 ka) and N (5064 ka) from a much smaller dataset [29,30]. The authors note that the values could be increased by 11 per cent if the colonization dates subsequently increased to 50 ka, and a similar order increase has in fact happened [31].
The main remaining issues are calibration, the effects of serial bottlenecks and wide confidence intervals of estimates, thus affecting accuracy and precision. Such continuing issues should stimulate efforts to improve methods. This means that genetic dating may not replace good archaeology and precise carbon-based and other dating methods (e.g. evoked luminescence) on identified fossil sites for accurate dating of key events in human migration prehistory. It is, however, important for triangulation to have direct, independent dating of each proxy for the past (archaeology, palaeoanthropology, geology, genetics and even language), because heavy reliance on one method leads to circularity and self-fulfilling models.
The resulting depression of relevant haplogroup ages brought about by the new calibration, and new archaeological evidence pointing in the other direction, inevitably prompts a review of the discourse on AMH exit before or after Toba. Recalibrated mtDNA dates derived from a paper by Soares et al. [7] will be cited subsequently as evidence in this review for consistency, but not as the last word on mtDNA dating.
Previous Section Next Section 4. Review of out-of-Africa models
(a) How many exits of anatomically modern human ancestors from Africa? The genetic evidence (i) Multi-regional versus recent replacement Darwin [32] first suggested that humans originated in Africa, based solely on the presence of chimps and gorillas there. Since then, there have been two contrasting models of how and when our ancestors left Africa. The multi-regional hypothesis postulated that non-African regional populations each descend largely from separate migrations of Homo erectus, occurring over a million years ago. Multi-regionalists rationalized that the tendency for modern regional populations to resemble each other morphologically, more than any of them resemble their putative H. erectus ancestors, resulted from modern gene flow between populations, rather taking the punch out of their own theory, but leaving a testable hypothesis. The other main testable out-of-Africa view, the recent replacement model, postulates that AMH originated from African stock within the past 200 ka and, having replaced other human groups in Africa, then left within the last 100 ka and replaced all pre-existing human groups outside Africa (reviewed by Oppenheimer [11]). Limited archaic interbreeding outside Africa: it should be noted that, contrary to a perception common among multi-regionalists, the replacement model does not depend on the concept that AMH was necessarily a new human species rather than, say, a gracile version of Homo heidelbergensis and/or sibling race to other large-brained humans, or that there was a lack of inter-fertility or limited interbreeding initially, between these different regional human populations. The model merely asserts that there was, subsequently, a near-complete, recent physical replacement by AMH.
It is important to clarify the latter perspective and lay to rest the assumption, sometimes made, that any evidence of archaic admixture outside Africa, however small, would necessarily disprove the recent replacement model. The issue could be raised for instance by recent claims of a 14% introgression of Neanderthal genome into modern Eurasians [33]. However, these are not necessarily at variance with the view of near-complete replacement, in spite of the absence of evidence of Neanderthal introgression among the many tens of thousands of uniparental genomes studied. It should be remembered that the effective population size of the haploid uniparental genomes would be a quarter that of autosomes, predicting more severe drift and lineage extinction on uniparental loci.
This difference in drift between the two kinds of loci can be directly demonstrated. A good example is the observation that although autosomal loci do show a regular, progressive loss of diversity (e.g. in measures of heterozygosity) with increasing distance east from Ethiopia to the Americas, consistent with a serial founder effect [34], this decay effect is linear and, unlike uniparental loci, shows no sudden step fall on leaving Africa. By inference, this lack of an initial step-drop in diversity means that many autosomal loci probably preserved (i.e. carried-over) multiple alleles on exit from Africa. In contrast, the finding of only single recent African lineages represented on mtDNA and NRY outside Africa (L3 and M168, respectively) itself suggests a very severe initial founding drift effect in those loci immediately after exit. This susceptibility to drift would subsequently have tended to cause the extinction of any minority exotic mtDNA lineages, such as the less than 4 per cent maximum Neanderthal introgression (estimated from the autosomes outside Africa).
Whether such hypothetical extinction of acquired uniparental Neanderthal lineages could have occurred with admixture outside Africa (Green's preferred geographical option) is clearly debatable and depends on where and how soon admixture occurred and what population sizes were involved. However, it is difficult to imagine any scenario in which the ancestors of East Asians could have simultaneously acquired the same dose of Neanderthal autosomal genes as those of Europeans, unless it was soon after the exit and before eastwest divergence. As the authors acknowledge, for this to happen: gene flow from Neandertals into the ancestors of non-Africans occurred before the divergence of Eurasian groups from each other ([34], p. 710), thus implicitly depending on the single exit hypothesis for AMH, as applied in this case to autosomes. In order for Neanderthals to admix with the common ancestors of all non-Africans, however, they would have had to be in South Arabia at the time. The only evidence for this is the abundant Middle Palaeolithic record there, which certainly raises that possibility.
There is an alternative scenario Green and co-workers wisely did not consider in that publication but, as co-workers, do offer more recently in the context of the Denisova hominin phalanx and tooth found in a Middle Palaeolithic/Upper Palaeolithic transitional context in Southern Siberia [35,36]. This is the possibility of interbreeding with other recent, large-brained, putative H. heidelbergensis descendants in China such as the Maba, Dali (and Jinniushan) types who, on geographical distribution grounds, may have taken the southern route to the Far East.
In this instance, 46% of the provisional autosomal sequences from the Denisova finger bone are apparently found in two Melanesians but in no other modern human groups tested so far. MtDNA sequenced from the tooth is very close but not identical to the phalanx found at the same site; and both fossil mtDNAs are deeply separated phylogenetically by an estimated 1.04 Myr from Neanderthals and AMH. Morphologically, the Denisova tooth groups tightly with australopithecines, Homo habilis and African H. erectus. This archaic dental group shows a wide split from a more modern group containing Neanderthals and all other European humans (ancient and modern), all AMH and curiously Chinese H. erectus. Indonesian erectus specimens alone took an intermediate position between the two groups. Given the latter observations, the morphologically archaic nature of the Denisova tooth and the Melanesian DNA connection, it is a pity that recent archaic Chinese Homo specimens (e.g. Maba, Dali and Jinniushan), modern Melanesian, Australian and Homo floresiensis teeth could not all be used as relevant types for comparison. In contrast to the erectine morphological qualities of the Denisovan tooth and the divergent mtDNA, comparison of Denisovan autosomal DNA with AMH and Neanderthals was however surprisingly anomalous, in that a closer relationship was inferred between Denisova and Neanderthals than either had with AMH [36]. The strength of evidence for this assertion of more recent common ancestry for the two archaics was, however, less convincing than that for Neanderthal intrusion into AMH. This is because the alternative explanation for the archaic autosomal sequence associations was not tested. This alternative was extended direct interbreeding between Neanderthals and Denisovans due to their clear geographical and temporal overlap in Central Asia.
The possibility of more archaic admixture in Oceania is reinforced by a new paper showing, as predicted above, Denisovan admixture in 100-year-old Australian aboriginal hair, similar in degree to that in Melanesians. Unfortunately, the interpretations made on the findingswhich postulate an early archaic Australian wave from Africa 62 00072 000 years ago and a later Asian wave 25 00038 000 years agoare influenced by an old morphologically based two-exit AMH model (see §4a(iii)) and a selective use of autosomal dating of demographic events, unsupported archaeologically. Their analysis and interpretation depend on a statistical test based on only four complete genomes. As their actual results stand, however, they merely extend the influence of Denisovan DNA in Oceania and do not falsify the model presented here [37]. Indeed, there is morphological evidence that would reverse the order of the two Australian waves because the earliest human crania in Australia are modern and gracile, whereas there is a late appearance of archaic and robust skulls in the Kow Swamp and Coobool Creek sites, radiocarbon-dating to no earlier than 14 300 years ago [38].
Genesis of the recent replacement view: the morphological evidence for recent replacement by AMH actually just predates the genetic evidence [9]. Stringer's [39] definitive paper, whose genesis goes back to a similar one in 1984, was written and presented in 1986. However, the difference in timescale along with the sharply different colonization models offers further proof, in that several predictions can be tested by genetic phylogeography, using non-recombining DNA such as mtDNA and the Y chromosome. Under the multi-regional hypothesis, today's non-African populations should possess some recent lineages and a substantial mixture of ancient lineages (i.e. much more than a few per cent) as old as, or maybe older than, those in Africa, such similarity signalling multiple exits over the past million years. These predictions of multi-regionalism are clearly not fulfilled. Conversely, recent replacement outside Africa should show older lineages within Africa and nearly exclusively young lineages outside, depending on the completeness of replacement as is the case.
When Africa and the rest of the world were first compared using the uniparental mtDNA locus in 1986 [9], the evidence for the recent out-of-Africa model was strongly supported, in that the two trees rooted deeply in sub-Saharan Africa (SSA) with derivative branches outside. The first mtDNA tree was low resolution, with a number of African misclassifications. The mtDNA tree was improved and resolved by complete sequence data and a world tree, based on the first 52 complete sequences published, showed that all non-Africans belonged to two sibling twigs (M and N) both arising from L3, one of over a dozen unique African branches (fig. 0.3 in Oppenheimer [11], reproduced here as figure 2).
Two phylogeographic predictions of the recent replacement model are fulfilled in the first resolved, dated worldwide CS-mtDNA tree (figure 2). First, of the dozen or more branches of the tree found only in Africa most, although young (less than 200 ka), are, as expected, much older than L3, M or N. The genetic age of the deepest branch (190 ka) [11] (192 ka in Soares et al. [7]) is consistent with the new dated fossil finds of early AMH in East Africa (164 ka [40]; 195 ka [41]).
Posts: 42919 | From: , | Registered: Jan 2010
| IP: Logged |
posted
ii) Single recent exit model for anatomically modern human Second, as mentioned already, the most singular observation for mtDNA is that L3, the remaining African branch, is not unique to SSA in that it also encompasses all non-Africans. L3 has several branches within Africa, but only two originating outside, namely M and N [11,42,43], and these two are also the only ones found throughout the rest of the world. In effect, this means that the rest of the world was also colonized by descendants of a single ex-African founding mtDNA haplotypethe root type of the L3 haplogroup (more specifically, a founding subtype of the main root holding a nucleotide transition at position 195, shared by M and N). The latter now dates by the molecular clock back 71 600 (CI: 57 100; 86 600) years [7]. N and M outside Africa overall both have similar ages, which are older than their derivative African re-entrants (see §4a(iii)), and on average around 10 kyr younger than their immediate founding ancestor L3-195. Two exceptions to this are N, when dated nearest to Africa, in west South Asia at 71 200 years (CI: 55 800; 87 100), and M dated in India at 49 400 years (CI: 39.0; 60.2). Their inferred origins are located, respectively, in the Gulf region and in India, with widespread co-distribution outside Africa [11,42,43].
This non-African origin of the two L3 branches (M and N) found outside Africa is, ultimately, unambiguous evidence of a single successful L3 exit from Africa, and until recently was paralleled in the male Y chromosome tree [11,15,22], but with two branches, CF and D, both defined by the same single nucleotide polymorphism (M168), originating outside Africa [44] (but see §4a(iii)). That all non-African descendants, for both mtDNA and Y twin lines, each share one and the same close African ancestor is the result of severe drift in uniparental lineages, resulting from a period of isolation in a small founding group, during which all other lineages in the group were lost by genetic drift (see above). But such singularity, in itself, provides serendipitous, unequivocal, proof of the single successful AMH exit, not usually available from autosomes, with their higher effective population size. The chances of two or more founding-exit episodes separated in time and place each giving rise, by drift, to the same two single-source African lineages (or one of each) in all the different parts of the non-African world are vanishingly small, leaving the single exit statistically by far the most likely solution. Such severe single drift at exit is clearly reflected not only in uniparental loci but also in the X chromosome and in several autosomal loci studied [15].
It should be noted that although the evidence and logic for a single successful ex-African AMH mtDNA founder lineage is clear (and forms the basis for the rest of this review), the scenario is surprising and counterintuitive. In the absence of severe drift, a single exit group would be expected to involve multiple founder lineages spreading to different Eurasian locations. A single founder picture is not seen in any other continent-to-continent colonization. For instance, the colonization of the Americas involved five founder mtDNA lineages [11], whereas New Guinea and Australia have, between them, over a dozen ancient founders (see §4c(iv)). For uniparental loci, the most severe bottleneck was thus apparently the first exit, with serial unequal splits, bottlenecks and loss of diversity occurring all the way to the Antipodes and the Americas.
(iii) Models with multiple exits: the Cambridge model Models including more than one exit have, in the past, been the default (reviewed in Oppenheimer [11]) and are exemplified in publications by Foley and Lahr of Cambridge University and others [13,14,4547]. These multiple exit views are all essentially prefigured by cranial morphological analyses of the 1990s [13,46]. That work postulated multiple land-locked islands of populations of modern humans scattered within the arid Palaeolithic landscape of SSA. Being morphologically different, sub-sets of these population islands would then have constituted the discrete sources of subsequent morphological diversity outside SSA, as a result of multiple separate outward migrations. This view was the basis of a later collaborative publication, which effectively matched Y chromosome lineages secondarily to the morphological multi-migration model [13,14], and a book which further elaborated the same model adding genetic data from Central Asia [48]. This apparent dominance of morphological over genetic arguments for numbers and directions of African exits seems odd in retrospect, given the greater specificity of the genetic evidence, but may reflect the early difficulties of getting uniparental evidence to be taken seriously, even by population geneticists. These morpho-genetic models of the early twentieth century argued for two main exit routes. The first was a southern one across the mouth of the Red Sea 5045 ka, towards Australia and carrying two of the three non-African Y branches, DE and C (in 2002, Y Chromosome Consortium nomenclature [49]; fig. 3c in Underhill et al. [14]), leaving, as relict descendants, small populations around the arc of the Indian Ocean coast such as Andaman islanders, southeast Asian Negritos, Melanesians and Australians, but also with genetic traces in Japan and North America [14,48]. Second and separate from these minority early southern route migrations, it was postulated [14] that the bulk of Eurasian populations, derived from East African F lineage, migrated through northeast Africa to the Levant around 45 ka, and subsequently dispersed variously towards west to Europe and east to the rest of Eurasia between 40 and 20 ka
Problems with Y chromosome evidence offered for multiple exits: the foregoing view ignored the fact, implicit in the data, that the Y chromosome tree outside Africa showed a phylogeny similar to that of the mtDNA tree, with one African branch (CDEF) defined by the mutation M168, accounting for all non-Africans [50]. Furthermore, the view of the relicts of earlier exit populations deriving solely from the exit(s) of sub-clades D and C was contradicted by pre-existing phylogeographic evidence [50], which has been confirmed since then [11,22] using DNA obtained from the same so-called relict groups in the Antipodes who possessed ample regionally unique lineages derived from the third Y branch F. Additionally, the claimed, close distributional correspondence of mtDNA haplogroup M with Y sub-clades D and C [14] was undermined by a similar widespread correspondence with the second mtDNA haplogroup N in the same places, including the Antipodes. As will be discussed below, this author, and others, argued logically, both from mtDNA and Y chromosome evidence, for a single definitive exit, probably by the southern route ([11]: ch. 4 and figs. 4.24.5) [15,25].
Subsequently, Underhill [22] has implicitly acknowledged these counter-arguments to multiple exits by co-workers in a more recent, combined Y and mtDNA paper. However, there is still a remaining problem of fully reconciling the Y chromosome evidence with that from mtDNA. The problem is found in one of the three Y branches, represented among non-Africans: DE (defined by the YAP+ mutation). This has a disjunct geographical distribution, with the D sub-clade, represented at low levels only in South and southeast Asia and in Japan, while E is represented, on the one hand, locally throughout the Middle East and Europe as a sub-clade E-M35 [51], when on the other hand, the remaining uniquely African E sub-clades make E the commonest Y clade in Africa [50]. Furthermore, while the distribution of D marks it as uniquely East Asian, and one of the original single exit clades, its fraternal sub-clade outside Africa (E-M35) has been argued to have left Africa much later, around or since the Last Glacial Maximum and probably not by the southern route [15,52,53], potentially partially falsifying the single exit hypothesis.
These observations seem to mean that, unlike the mtDNA exit, which is defined by a single branch L3, splitting outside Africa into M and N (see below), up to three Y branches (C, D and F), albeit very closely related, could have split before the initial exit from Africa, rather than after. The argument for this scenario is that the ancestor to D could not have split off after exit, from a single M168-CDF common ancestor outside Africa, leaving E behind, because D and E are both defined by YAP+ and form their own sub-clade [15].
A recent review by Underhill & Kivisild [44] appears partially to solve this conundrum, and to make the single group exit even more convincing, because they use a newer phylogenetic marker, P143 [54], to define a single exit for CF before C and F separated, thus leaving only two Y lineages in the southern out-of-Africa movement: namely D and CF. The unity of C and F at exit incidentally also further renders Underhill's original model, with an earlier exit of C and D before F, impossible and reconciles the finding of C and F together in the Antipodes.
There is yet a further twist to this story that could result in going full circle back to a model first proposed by Hammer et al. [55] in 1998, and previously supported by Oppenheimer [11], known as Out of Africa and Back Again, whereby the YAP+ mutation occurred outside Africa, forming the DE clade and this dispersed on to East Asia, becoming D, while a second DE branch returned to East Africa, there becoming E.
Fittingly, Underhill (who originally opposed this model) is the senior author on a recent paper offering new phylogeographic evidence that could support it, including a simplifying revision of the E phylogeny, and finding two examples of underived root-types of E in Saudi Arabia [56]. This model would specify, as for mtDNA, a single exit Y lineage and two non-African descendant branches arising outside Africa. To quote: Regions near but external to northeast Africa, like the Levant or the southern Arabian Peninsula could have served as an incubator for the early diversification of non-African uniparental haplogroup varieties like Y chromosome DE-YAP*, CF-P143* and mtDNA M and N molecular ancestors ([56], p. 66). The model also predicts that E1b1 (the main trunk of E defined by P2) probably arose in East Africa after DE backflow there.
In line with this prediction, there is now more recent evidence consistent with, firstly, only two primary branches of E1b1 (rather than three as previously thought), but also with their joint East African origin. This includes not only the E-M215 branch carrying the E-M35 sub-clade, for which latter such geographical evidence already exists, but also the other new main E1b1 branch, defined by V8 and V100. This V8/V100 stem now clearly includes the E-M329 branch, observed almost exclusively in East Africa, whereas the rest of the large African branch, previously defined by E-M2, was puzzlingly virtually absent there [51,57]. Remaining, non-P2, minority branches of E, E1b2 and E1a are also found in East Africa (as well as North Africa) [51], consistent with an ultimate E origin in East Africa.
Worldwide tests of prediction: one of the testable predictions of the multiple exit model is that various populations including the so-called relict groups around the Indian Ocean should show different mtDNA and Y lineages from the rest of the world, as evidence of arising from separate exits. This prediction was first tested formally in 2003 [11], by comparing what was known about uniparental lineages in multiple putative relict or aboriginal populations in South Asia, the Indian Ocean, southeast Asia and the Sahul. Multiple exits were found unsupported for mtDNA because all known lineages in these groups belonged to M and/or N haplogroups. In other words, all non-Africans were descended from L3 (figure 2), including all relict non-African groups, thus supporting the single exit ([11]: chapter 4 especially endnote 5 and figs. 4.2 and 4.3). Similarly, all Y lineages in relict groups belonged to C or F. These inferences have been confirmed several times since, with the same single exit conclusion, using larger sample sizes and at higher sequence resolution [25,58], and more relict groups, such as Andaman Islanders, who also held D [59], Melanesians and Aboriginal Australians [22].
(iv) Backflow into Africa A critical issue in establishing the location of origin of the M and N mtDNA L3 subgroups was explaining the presence of 15 of their branches (1 M; 14N) in a well-conducted study in East Africa, together amounting to 47.8 per cent of mtDNA lineages in Ethiopia, but very little anywhere else in SSA [60]. The equivalent of retention of M and N lineages across the water in Yemen was similar at 47 per cent. Was that evidence of local origin in Ethiopia or backflow from Arabia? Clearly, it was the latter: for N branches, the issue was straightforward, because the Ethiopian branches were not only much younger (12.614.4 ka) inside Africa than their equivalent outside, but they were ultimately derived from well-established non-African sub-clades of N. For M, it was slightly different in that the only African M branch, M1, was derived, but apparently had no precedents elsewhere, apart from root-M outside Africa. However, with an age of 41.2 ka (SE17), which is clearly younger than the rest of M outside Africa, M1 was unlikely to represent a solitary African stay-at-home [60]. Male backflow from Asia to Africa has been shown for non-African Y involving F and E-M35 [61], although E-M35 is likely a returnee of East African rather than Middle Eastern origin [52]. Haplogroup F backflow only accounts for 1040% backflow and is confined to North and East Africa [61]. If, however, as suggested in §4a(iii), DE-YAP* originated just outside Africa, then technically non-African backflow in the Y locus includes E and could ultimately massively outnumber the original African Y throughout Africa, ranging from 59 per cent (rather higher than mtDNA figures cited above) in East Africa and 6580% in South Africa, to well over 90 per cent in West Africa (data from Cruciani et al. [61]).
Cruciani et al. [62] have recently extended their description of NRY backflow by showing backflow of Eurasian haplogroup R1b1 (ultimately belonging to the F clade and defined by P25) into North and Central Africa. Phylogenetic evidence and coalescence time estimates of a newly identified marker, V88, suggest that these chromosomes may have been carried to Africa by an Asia-to-Africa back migration, through northeast Africa to the central-western part of the African continent (northeast Cameroon), where they can be detected at frequencies as high as 95 per cent in Chadic-speaking peoples from the Central Sahel and several other Afroasiatic-speaking groups from North Africa, while having much lower rates among surrounding Niger-Kordofanian-speaking groups. The R-V88 coalescence time was estimated at 9.25.6 ka, in the Early Mid-Holocene [62], suggesting the effects of the interglacial optimum window, greening the Sahara and the Chad Lake basin, thus allowing the spread of people and pastoralism south into SSA.
(b) Which route? A single successful African exit for AMH has several clear implications. The simplest, but most important of these is that the number of possible subsequent route options was also consequently decreased. Whichever route was taken initially, however, the model thus has to explain how both Europe and Asia could have been colonized ultimately from the same single exit group. (i) Southern rather than northern exit: genetic evidence As to which route, there are four potential corridors leading out of SSA, three of which involve some water-crossing. Two of these would be north direct to Europe, to Gibraltar or, via emerged Malta and Sicily landmasses, to Italy. There is no evidence (archaeological or genetic) for early AMH taking either. This leaves the two most commonly suggested: northeast to the Levant across the Sinai from Egypt after crossing the Sahara, and east across the mouth of the Red Sea from Djibouti, thus by-passing the Sahara, to take the coastal route to South Asia. As far as the genetic evidence is concerned, there are two logical reasons for identifying the southern route across the mouth of the Red Sea as the most likely defining exit route. Firstly, both of the two primary branches of the L3 mtDNA haplogroup outside Africa (M and N; figure 2), are represented in East Eurasia, including South Asia (where they have the highest number of autochthonous M and N lineages in the world), while only N is represented in the Near East/Europe where it is younger than in South Asia (§4c(iii)). Second, all the primary branches of N are represented in South Asia [43], whereas the Levantine and European N representatives are less diverse, more derived and younger than those in South Asia (for an in-depth discussion, see earlier studies [11,15]). The single southern exit is also consistent with the earlier archaeological luminescence dates for colonization of the Philippines and Australia than of Europe.
(ii) Climatic constraints and opportunities for an exit route Another implication of both the single genetic exit and drift is that there must have been great difficulty in establishing a beachhead outside SSA during the Late Pleistocene, presumably as a result of the SaharanArabian arid zone creating a barrier to migration out of SSA between 90 and 48 ka [63], but also a barrier to movement between South Asia and the Levant across Arabia (figure 3). The Sahara and the evidence for earlier arrival in Australia than Europe (§4c(ii)) logically points to the southern route. There is the question of drinking water along a desert salt-sea coastline such as the southern Arabian Peninsula. Sauer [64] has, however, pointed out that low-tide fresh-water seeps occur even on desert beaches. Paradoxically, emerged aquifers may have been the more abundant coastal sources of groundwater, during periods of low sea level [65].
(c) Dating migrations (i) Possible dates of the definitive exit Dated archaeological evidence for the exit is lacking at the Bab El Mandeb or on the Arabian coast because sea-level rise has drowned most coastal remains. An exception is some dated cultural evidence at Jebel Faya (see §4c(iii)), which starts far too early for continuity with the genetic evidence, even with the latter's wide confidence intervals. Much of the relevant datable evidence lies either in India or on the eastern side of the Indian Ocean. As mentioned above, a general guide to earliest possible date, and excluding any Eemian exit as lacking progeny, is the genetic age of expansion of L3 at 71 600 years ago (CI: 57 100; 86 600), which crucially includes African L3 [7]. For the lower limit, N, one of the two daughter lineages of L3 outside Africa has been dated near its putative origin in South Asia, where it has a predominantly western distribution, to a similar 71 200 years (CI: 55 800; 87 100). M, the other branch, is surprisingly young in South Asia, where it has a predominantly eastern distribution (see §4c(iii)) at 49 400 years (CI: 39 000; 60 200) [7] (figure 3). (ii) Delayed migration to the near east and Europe It is important to explain the issue of the ultimate origins of West Eurasians out of the southern exit route. However, the problem remains as to how and when ancestors of northwest Eurasians crossed the arid zone between South Asia and the Levant/Turkey, and why they were delayed. Today, there is a green corridor running through the Iraq/Iran arid region, northwest between the western slopes of the Zagros mountains and the Tigris River ending in the Taurus mountains of Anatolia. This would have been closed and arid between ca 90 and 47 ka, i.e. during cold stages OIS-5b 4 and half of 3 [63] (see also Selivanov [66]).
A partial amelioration of climate occurred around 48 ka with DansgaardOeschger Interstadial 14 (e.g. fig. 2 in [67]). With appropriate radiocarbon correction [68], this period would have also coincided with the brief period of raised humidity in the Arabian arid zone 45 ka C14 years ago [63]. A climate permissive model can be reconstructed [12] of AMH populations suddenly being able to move into northwest Eurasia from South Asia only at ca 48 ka (see fig. 1.8 in [11]). This dating would coincide with the earliest appearance of Upper Palaeolithic technology in the Levant and southeast Europe (calibrated to 47/49 and 46 ka, respectively [68]) and also with the age of U8, the oldest mtDNA N lineage in the Near East and Europe (at 51.3 ka (44.058.8) [69]; see also [11,15]).
(iii) Dating appearance of anatomically modern human outside Africa: Eemian, pre-Toba or post-Toba Eemian exits and fossils: there is clear archaeological evidence for an earlier AMH exit to the Levant during the moist Eemian interglacial, based on fossil and lithic evidence, dating between 120 and 90 ka [70,71]. Dry glacial conditions returned and Neanderthals then reappeared in the Levant from around 60 ka, but there was a long gap of up to 40 kyr between the last Skhul and Qafzeh AMH skulls, and evidence of the reappearance of AMH in West Eurasia was reported no earlier than 49 ka [68]. Non-African MtDNA and Y chromosome phylogeography and dating evidence are not consistent with an ultimate survival of this northern colony into the modern gene pool, and the Levant exit is presumed abortive [12].
The proven Levantine AMH Eemian exit, however, means that similar Arabian-Far Eastern claims for a southern Eemian AMH exit may well turn out to be correct, although carrying the same lack of genetic evidence for survival. Five such claims currently vie for attention, all with date brackets similar to those of the Levant exit, four with fossils and one with cultural evidence. The latter is at Jebel Faya on the Arabian Peninsula, where lithics with affinities to the Late Middle Stone Age in northeast Africa date between 127 ka and 95 ka [18] (reviewed by Petraglia et al. [16]; Rose [72]).
Similarly, a recent finding of an anterior mandible with two molars at Zhiren Cave in South China was dated by flowstone context to 113100 ka [17,73]. The AMH attribution was unconfirmed, and even the authors suggest hybridization. The presence of AMH in Java during OIS 5e was recently suggested, on the basis of one hominin tooth [74], first described in 2005 [75], small enough to suggest AMH, and previously found in breccia in Punung cave in southeast Java. The date claim is explicitly tentative and indirect, as must be the attribution. Finally, the famous south China Liujiang skull is indubitably AMH, but controversially dated to 111139 ka by other items in the breccia in which it was found [76], which could put it in the same Eemian age range as the Zhiren Cave and Punung Cave fossils. A lower date of 67 ka based on the covering flowstone seems, however, far safer [12].
The recalibrated age estimates and confidence intervals of the out-of-Africa mtDNA branch L3 of 71 600 years ago (CI: 57 10086 600 [7]), although wide in this context, exclude the date ranges implied by an Asian Eemian exit (as did previous L3 age estimates [11,12]). So, one has to presume that, such as the Skhul and Qafzeh exit, any Asian exit by AMH during the Eemian must have been evanescent. This view is supported to some extent by the archaeological record in all these cases of the putative early exitfor instance the Jebel faya record, which stops at 95 000 years, far outside the range of L3 age estimates. Autosomal loci with more detail and much larger effective population size may ultimately disprove this perspective, as with Neanderthal admixture, but autosomal dating is currently unreliable.
Exit before the Toba super-eruption (74 ka)? The first out-of-Africa model to suggest the definitive AMH exit before the Toba eruption [11] used the Tampanian pebble tool culture of the Lenggong Valley, Perak, Malaysia as partial cultural evidence, although no fossils were found with the tools covered in Younger Toba Tuff (YTT: ash). The same lithic culture persisted locally, however, latterly associated with AMH, until the Mid-Holocene. Similar lithic cultures from Indonesia dating to around 70 ka are reviewed elsewhere [11,12], but see caveats [77].
Similar claims for pre-Toba exit were made recently for YTT strata in India [16,78], but in this case, the lithic culture above and below the ash was Middle Palaeolithic (MP), with the added argument that local typology better matched South African Middle Stone Age than North African or Levantine MP. Matching such typological comparisons too closely to hominin type does not currently get a good archaeological hearing [77], as was the case here. However, a follow-up detailed description of methods at a recent meeting on Toba in Oxford (February 2010) convinced several, but not all, seasoned archaeologists in the audience (reported in [79]). The meeting held another surprise, in that dating of cultural layers below and above the YTT had not previously been shown to other collaborators. Previously pre- and post-Toba-ash cultural dates for the first site [78] were both very close to the eruption (YTE), but in the new results on nine paired Indian sites, only the pre-Toba dates were close to the YTE at 74 ka BP or earlier, whereas nearly all of the post-Toba dates were about 55 000 years BP or younger [79], thus raising a question mark over the group's key claim of rapid human recovery post-YTE.
Genetics and Toba: a prediction of this author's interpretation of the conjunction of tools and ash in India is that a deep genetically sterile furrow would have split South from southeast Asia, with India eventually recovering from a genetic bottleneck either locally or by re-colonization from either side. Such a furrow was first argued for in the genetic map of South Asia ([11], pp. 180184). India is characterized by an abundance of unique local diversity as evidenced by a number of uniparental lineages [41,8082].
Apart from the complete change in representative mtDNA haplogroups between Eastern India and Indo-China, tribal populations on the East Coast of India predominantly exhibit unique M groups and lack N subgroups, consistent with local drift resulting from near extinction. Also consistent with the possibility of local Indian bottleneck, M groups in Eastern India around the Bay of Bengal, although numerous, are systematically younger than elsewhere along the Indian Ocean trail [11,12] (see also table 1 in [80] and table 3 in [7]). However, dates for haplogroups N and R, which locate further west in South Asia, where less ash fell, are relatively higher (see fig. 3 in [12] and table 3 in [7]), consistent with local drift near the east coast of India and a pre-Toba exit.
In summary, the new cultural dates and lithic arguments presented at the recent Toba meeting in Oxford are consistent with this author's long-held speculation on a near pre-Toba AMH colonization of Asia, interrupted by the YTE, and followed by a slow demic recovery in India, but continuity existing elsewhere. However, this is not the final proof and, as mentioned already, the calibrated genetic age (CI) of the exit mtDNA branch L3 is 71 600 years ago (57 100; 86 600), thus bracketing Toba and neither clearly proving nor convincingly excluding a pre-Toba exit.
Post-Toba anatomically modern human fossils in southeast Asia: diagnostic, well-dated fossils are the gold standard in proving presence. Unfortunately, as in Europe, the realities of stone tool production and bone preservation make cultural remains vastly more common than fossils. The oldest dated AMH fossils in southeast Asia show a much older age bracket (6740 ka) than the oldest such fossils in Europe (35 ka or less [83]). However, with the possible Eemian exception of the Punung tooth (§4b(ii)), none predate Toba.
There is currently no firm fossil support for AMH dispersal to SE Asia before Toba (74 ka), let alone of antiquity anywhere near the Eemian, as claimed for the Zhirendong mandible in China (§4b(ii)). Fossil dates however do seem consistent with AMH presence in southeast Asia (and China) by at least 67 ka. The oldest dated human fossil in southeast Asia is now a single human third metatarsal from Callao Cave in Northern Luzon, Philippines [84], with a minimum age of 66 700 ka (±11 ka). There is the inevitable problem of identifying which human the metatarsal belonged to. The bone is gracile, consistent with AMH, but is small, and in the size range of adult local Negritos and that inferred from the Niah femur [85]. However, the size is also consistent with H. habilis and H. floresiensis. The age cannot be assessed accurately owing to the absence of the metatarsal head, although a young adult or adolescent is suggested.
The next oldest human fossil in the region is most likely AMH. A dozen AMH individuals have now been excavated from in-and-around the Tabon cave (Palawan, the Philippines), with fragments including a diagnostic frontal bone and mandible dating from 16 500 to the oldest, a tibia, at 47 ka in age, using Uranium series [86].
Next among these meagre island southeast Asian fossils aged over 40 ka is the site of the Niah Cave Deep skull in Sarawak, Borneo. Originally dated at around 40 ka in the early days of the radiocarbon method, the AMH skull site has been re-excavated and securely redated using the ABOX-SC method and bracketed at around 42 ka (4540 cal. ka BP [87]). The associated cultural sequence goes back at least to 46 ka (46 cal. ka BP [88]). Contemporary to the Niah skull is the aforementioned Timor beachcombing site at the Australian threshold, unfortunately lacking fossils [20].
However, there is a problem with the newly recalibrated estimates of genetic ages for M, N and R haplogroups in East Asia, now clustering at around 60 ka BP or less [7], 515 ka lower than estimated before [12], rather than the new archaeological estimates of up to 67 ka BP. Admittedly, the new genetic confidence intervals of all three haplogroups are still sufficiently wide to include 67 ka BP.
(iv) Dating Pleistocene arrivals of humans in Sahul and near Oceania Archaeology, radiocarbon and luminescence-dating: for Melanesia, the first archaeological evidence of occupation of the island of New Guinea has been radiocarbon dated to 49 ka BP [89] and 40 ka BP to the east, in New Britain island [90]. For Australia, the carbon ceiling has been increased to around 48 ka using the ABOX-SC method [91]. Non-carbon dating techniques, however, suggest an earlier human colonization of Australia by 5060 ka [9295]. There is clearly more work required with non-radiocarbon-based techniques. This review is not intended to replace those existing reviews, which are more focused on that controversy. It merely points out that the present oldest non-carbon dates are not inconsistent with colonization by 5060 ka. Bird et al. [95] have reviewed the recent literature, suggesting the arrival of H. sapiens in Australia conservatively by at least 48 ka BP, but that the chronological evidence argues for rather earlier than this. Recent sea-level curves, concentrating on troughs [96], suggest that the best window of opportunity for such a long crossing over the large Sahul shelf would have been 65 ka at a trough of −100 m, with occupation in the Northern Territory only becoming visible on modern littorals from 6050 ka owing to higher modern sea levels [10].
Sahul genetics: as mentioned already, genetic phylogeography is a better tool for topography than for dating, offering two points. First is the resolution on the descent of all Melanesians and Australian aboriginals on uniparental lineages from the single southern exit [11]. Extensive further work on Australian and Melanesian CS-mtDNA and NRY has not falsified this assertion [22,25,97].
The second point is whether Australia and New Guinea were colonized in parallel and independently, or serially, or by both models. Australians and New Guineans, although genetically more like each other than they are to, for instance, southeast Asians, have deep genetic divisions at several loci [11,98]. However, by 2004 it became clear from complete sequence data and the rare presence of variants of the characteristic Melanesian P mtDNA clade, both in southeast Asia and in Australia, that there were at least some common genetic sources and/or direct interchange between the two land masses [98]. Recent CS-mtDNA data [22,99] confirm a much more substantial P clade connection and it can be inferred that both these models are correct and that New Guinea was probably colonized in parallel, at a similar time, to Australia, sharing several sources but not others. So, much of the genetic difference between them may derive from subsequent isolation rather than from different sources. Recent autosomal work has independently supported this conclusion [100].
Previous mtDNA genetic dates of arrival of the vanguard in the Sahul estimated by this author [12] were consistent with a pause of around 10 ka at the threshold of the crossing (i.e. from Sundaland/Wallacea). Combining the optically stimulated luminescence (OSL) colonization dates for Australia [92,93] with the recalibrated genetic ages of M, N and R in East Asia would now give no time at all for such leisure before arriving in Australia. This would still infer an extremely rapid transit from Aden at least up to the tip of Sundaland, of around 10 ka, given the recalibrated molecular age of the out-of-Africa L3 lineage at 71 600 years.
The speed of colonization inferred from the Australian archaeological dates above is consistent with the phylogenetic observation that the great arc of dispersal was effected entirely by the three primary root founder haplotypes M, N and R, each giving rise to multiple sets of unique regional daughter branches in every sector around the Indian Ocean. The only exception to this local primary starburst rule is the crossing to the Sahul, which was substantially colonized by derivative lineages exemplified by the P haplogroup, derived from R and originating in southeast Asia.
For Australia [22], there are nine unique founding lineages (M13, 14 and 42; S; N12, 13 and 14; P5′7 and Q2), implying multiple founder events. Melanesia (New Guinea and islands) has four unique founder lines, with molecular ages varying between 30 and 82 ka (M27, M29′Q, M28 and P2).
Additionally, there are a dozen haplogroups shared between Australia and New Guinea. It is clear that not only did the large P haplogroup ultimately originate in southeast Asia, where it is now extremely rare, but that it is represented in both Australia and New Guinea in more than half of its subgroups (P1′6′9, P3a, P3b and P4). Furthermore, this sharing derives in all cases from early splits [12], both before arrival as a result of common sources (e.g. P4) and as exchange between the two landmasses after arrival (e.g. P3a and P3b).
There is also similar sharing of an early source M lineage, M13′14′28′42, probably originating externally to the Sahul, which is mainly present in Australia as subgroups M13, M14 and M42, but has two branches in Melanesia (M28ab).
The remaining lineage sharing in Australia is a single example of the Melanesian subgroup Q2.
There are examples from the autosomes and the Y chromosome of post-glacial gene flow from New Guinea and southeast Asia to Australia; substantial gene flow between island southeast Asia and Melanesia commenced from the early Holocene (reviewed in previous studies [101103]).
5. Conclusions
The genetic, climatic and archaeological evidence logically suggests a single southern exit of AMH from Africa, probably during early OIS 4. All non-African groups today are descended from this exit, with the exception of some autosomes (7% or less) apparently derived from admixture with several archaic non-African groups. Whether this exit predated the Toba eruption is currently unclear. A series of founding bottlenecks characterized rapid migration around the Indian Ocean coast to Borneo and Bali at the tip of the Sunda shelf. Then, a sea-level low stand permitted multiple colonizations of the Sahul, followed by prolonged isolation until the post-glacial period, during which maritime gene flow from island southeast Asia recommenced. These last migrations were limited into Australia and substantial into Melanesia. Climate and access to fresh water were crucial determinants of routes and dates for windows of opportunity.
Dates of migration can only be approximated by genetic studies, while palaeoclimatology, palaeoanthropology and archaeology offer potentially firmer options. The possibility that AMH arrived in Asia before the YTE offers both an approach to dating and a source of controversy. Contentious AMH dates include the definitive exit from Africa, as well as first arrivals in India, China, Central Asia, Indo-China, Sunda, Sahul and the Americas.
Posts: 42919 | From: , | Registered: Jan 2010
| IP: Logged |
posted
This study is old stuff and Eurocentric too.
In the Oppenheimer map there are no migration lines within the whole African continent except the one for exit.
Given that humans originated in Africa and lived in Africa for approximately 100,000 years before migrating out of the continent--of course the migrants had no idea of anything about where they were migrating to--the migration routes within Africa would be many--much more than the routes external to Africa.
If there was only a single migratory group then the phenotypes of the Andaman Islanders and the Melanesians offer us a good idea of what the migrants looked like before being morphing to phenotypical varieties we now see in the world.
The phenotypes of the Andaman Islanders and the Melanesians would, therefore, seem to refute the claim that possible back migrations--R1, J, etc,--into Africa were people of different phenotypical appearance--unless such migrations took place very recently--i.e. post the Pharaonic Age.
Posts: 5492 | Registered: Nov 2004
| IP: Logged |
quote:Originally posted by lamin: This study is old stuff and Eurocentric too.
In the Oppenheimer map there are no migration lines within the whole African continent except the one for exit.
Given that humans originated in Africa and lived in Africa for approximately 100,000 years before migrating out of the continent--of course the migrants had no idea of anything about where they were migrating to--the migration routes within Africa would be many--much more than the routes external to Africa.
If there was only a single migratory group then the phenotypes of the Andaman Islanders and the Melanesians offer us a good idea of what the migrants looked like before being morphing to phenotypical varieties we now see in the world.
The phenotypes of the Andaman Islanders and the Melanesians would, therefore, seem to refute the claim that possible back migrations--R1, J, etc,--into Africa were people of different phenotypical appearance--unless such migrations took place very recently--i.e. post the Pharaonic Age.
Excellent point. For example, note the very ancient tools and other finds from the tip of Southern Africa, which supposedly was not populated until the Bantu migrations, but as we now see that nonsense is false. Same with the Sahara and every other part of Africa. As if Africans needed to wait 100,000+ years for non Africans to evolve and migrate back to Africa before Africans could migrate across the Sahara... Duh. Yet Africans were able to migrate to the 4 corners of the earth.
Posts: 8889 | Registered: May 2005
| IP: Logged |
Genetics has disproven this. Europeans have Neanderthal genes.
Palaeoanthropologist John Hawkes, Associate Professor of Anthropology at the University of Wisconsin writes in 2010:
''These ongoing studies are concluding that present-day genetic variation is inconsistent with a simple model where a random-mating ancestral population gives rise to todays global population by means of a staged out-of-Africa dispersal''
Like i said try to keep up to date...
The only nutters still clinging to out of africa are a few black supremacists like Zaharan, Troll Patrol etc on this forum, who want all races to merely be subsets of an ''original black african'' out of their own socio-political agendas.
Posts: 1575 | From: - | Registered: May 2011
| IP: Logged |
The Neanderthal genes are just 4%--which is hardly significant. This is just a small average which means that most Europeans wouldn't have Neander genes.
The OOA theory is now the dominant paradigm in Evolutionary Anthro. Chris Stringer, the doyen of the whole field will agree. LOL.
Posts: 5492 | Registered: Nov 2004
| IP: Logged |
posted
There are significant Neanderthal traits only found in Caucasoids.
OOA is no longer plausible, it has now shifted to hybrid and assimilation models, while there are still some proponents of multiregionalism.
Modern Human Origins: Distinguishing the Models Chris Stringer The African Archaeological Review Vol. 18, No. 2 (Jun., 2001), pp. 67-75
In this paper, Stringer distingushes between OOA and ''African Hybridization model''.
In light of the genetics, which show regional races have distinct archaic homo ancestry, Stringer like most other academics have now shifted to the hybridization model.
OOA has no proponents left, its been debunked. It predicted replacement and no interbreeding, so it's been replaced with the hybrid models, while some anthropologists stick with multiregionalism.
Posts: 1575 | From: - | Registered: May 2011
| IP: Logged |
posted
LOL! Eurocentric loons will stick to their nonsense no matter if the facts say otherwise. The fact is that all hominids were born in Africa and spread out to the rest of the planet.
Most of this nonsense about mixture is based purely on speculation and conjecture. It does not change the fact that anatomically modern humans originated in Africa and settled the planet. Whatever mixing that may have taken place does not change that fact as it was the exception not the rule.
Posts: 8889 | Registered: May 2005
| IP: Logged |
''The findings showed the species occupied a West Asian site called Dmanisi from 1.85 million to 1.77 million years ago, at the same time or slightly before the earliest evidence of this humanlike species in Africa.''
Posts: 1575 | From: - | Registered: May 2011
| IP: Logged |
posted
^ He said all Hominids, which isn't true. Homo erectus originated in Asia.
There is no evidence AMH originated in Africa either. Multiregionalists question the state of idaltu and other african findings as AMH.
Many anthropologists don't consider idaltu to be AMH, since it is far too archiac in morphology, hence its even classified as a subspecies and not homo sapien sapien (hss).
Posts: 1575 | From: - | Registered: May 2011
| IP: Logged |
quote:Originally posted by lamin: [QB] This study is old stuff and Eurocentric too.
In the Oppenheimer map there are no migration lines within the whole African continent except the one for exit.
Given that humans originated in Africa and lived in Africa for approximately 100,000 years before migrating out of the continent--of course the migrants had no idea of anything about where they were migrating to--the migration routes within Africa would be many--much more than the routes external to Africa.
Here is an example of an OOA map The topic is the route of migrants coming out of Africa naturally an Out Of Africa map is not focused on prior In-Africa population movements
Posts: 42919 | From: , | Registered: Jan 2010
| IP: Logged |
posted
''The findings showed the species occupied a West Asian site called Dmanisi from 1.85 million to 1.77 million years ago, at the same time or slightly before the earliest evidence of this humanlike species in Africa .''
Note that although the quote says at the same time , OR slightly before, Anglo grabs at the 'slightly before', before excitedly writing
fail. lol.Homo Erectus originated in Western Asia.
The conclusion doesn't warrant the celebration!
So much for the Foundation degree in Forensic anthropology.
as he reviewed the researchs implications for the role of Homo erectus in the spread of early humans, Dr. Delson sounded the familiar lament of paleoanthropology: Each new find raises about as many questions as it helps to resolve. http://www.nytimes.com/2011/09/01/science/01tools.html
Indeed.
Posts: 838 | From: London | Registered: Oct 2011
| IP: Logged |
If there was only a single migratory group then the phenotypes of the Andaman Islanders and the Melanesians offer us a good idea of what the migrants looked like before being morphing to phenotypical varieties we now see in the world.
The phenotypes of the Andaman Islanders and the Melanesians would, therefore, seem to refute the claim that possible back migrations--R1, J, etc,--into Africa were people of different phenotypical appearance--unless such migrations took place very recently--i.e. post the Pharaonic Age. [/QB]
"The first people to enter the Pacific came from Southeast Asia, along the stepping-stone island chain -- now Indonesia -- to ancient Australia and New Guinea, and to the nearby islands just to the east and southeast, the Bismarcks and the Solomons," lead author Jonathan Friedlaender told Discovery News. "They got there between 50,000 and 30,000 years ago, when Neanderthals were still roaming Europe -- very, very early in modern human prehistory," added Friedlaender, who is professor emeritus of anthropology at Temple University. Melanesia was also settled around this time, probably by individuals from East Asia. Although Melanesians today resemble certain African groups, they turn out to be genetically far removed from Africa. Melanesians(represented by the Papua New Guinean and Bougainville Islander) are the only known modern humans whose prehistoric ancestors interbred with the Denisova hominin, sharing 4%6% of their genome with this ancient cousin of the Neanderthal
Posts: 42919 | From: , | Registered: Jan 2010
| IP: Logged |
quote:Here is an example of an OOA map The topic is the route of migrants coming out of Africa naturally an Out Of Africa map is not focused on prior In-Africa population movements
.
I said that the map and orientation is Eurocentric because the human geographic delineation of the continents is purely arbitrary. What is so special about humans crossing over to the Asian sub-continent. Did they know where they were going? No!.
So to complete the picture and to give an objective scientific statement it would be better if the the movements within Africa for 160,000 years plus were also shown. The movements from East Africa to West Africa and Southern Africa are just as important as a move from East Africa to Central Asia.
quote:Melanesia was also settled around this time, probably by individuals from East Asia. Although Melanesians today resemble certain African groups, they turn out to be genetically far removed from Africa.
Wrong analysis:
Genetic differentiation tells us nothing more than the amount of time that some group A has separated from group B. A single group can split into 2 groups A and B for a sufficiently long time period so that the STR polymorphisms--i.e. the arrangements of the bases CTGA--are strongly disparate. But the 2 groups maintain the same phenotype because the environment in which they survive are almost identical.
And that's exactly my point: the Melanesians, Andaman Islanders and Africans are phenotypically alike because the OOA Melanesians and Andaman Islanders retained the phenotypical traits they left Africa with.
So, for example, are Fijians Africans in the phenotypcal sense of the term--which is all that really counts in the social world? It would seem so. I have seen Fijians play rugby--they very good at it--and their power, speed, and musculature equates that of West Africans.
Note that what is central in the analysis is the environment. Change the environment and you could minimally change the STR polymorphisms but maximally change the phenotype. Keep the same environment but separate the groups for a relatively long time--time enough for mutations to rearrange the ACGT bases--and you have phenotypic homology but great genomic disparity.
Posts: 5492 | Registered: Nov 2004
| IP: Logged |
Science Meets The Bible by Gert Muller, Pomegranate Publications, 2011
Science teaches that modern humans originated in East Africa and spread from there to the rest of the world. The Bible teaches that humans originated in the Garden of Eden and spread from there to the rest of the world. It is almost universally assumed that, in terms of location of origins, these versions are in conflict. For the first time a book challenges this assumption by referring to the relevant verses of Genesis which give the names of the lands just outside Eden and the rivers flowing through them. The Table of the Nations in Genesis is then called upon to confirm the location of these lands, two of which are in the neighbourhood of Cush in East Africa. The results are confirmed by extra-Biblical Jewish tradition such as the Book of Jubilees and the Book of Enoch.
They are also confirmed, surprisingly, by Egyptian sacred texts such as the Book of the Dead, the Book of AmTuat and the Book of Gates. These books locate the Egyptian afterlife paradise in the Tuat or Netherworld. The geography of the Tuat turns out to be based on the lakes, mountains, mammals and birds of East Africa and not Egypt as generally assumed. Influences are traced, by the author, from Central Sudan and Upper Nubia into Lower Nubia and then Upper Egypt during the predynastic brought by the Followers of Horus. Egyptian kingship and the white crown are amongst the influences that the author postulates as coming from Central Sudan.
Posts: 176 | From: london | Registered: Aug 2008
| IP: Logged |
Hello Goredema. Would these early people have had any relationship with the dwellers ofUr who left physical evidence of great civilizations before the Great Flood? Just curious if Ur at all fits into that ancient puzzle.
. .
-------------------- The nature of homelife is the fate of the nation. Posts: 2334 | Registered: May 2006
| IP: Logged |
PROOF I DEMAND UNBIASED PROOF Marcie boy White people hating black racist black supremacist. No your site will NOT do.
Posts: 3257 | From: Madisonville, KY USA | Registered: Nov 2011
| IP: Logged |
If Diop was correct that "caucasoids" derive form Grimaldi this is far before "Germanic invasions". If the Grimaldi mated with Nenaderthals it is thought that the Neanderthal was more cold adapted and admixture with Neanderthals provided homo sapiens immunity to certain diseases. Here is a good explantion for the demise of earlier Grimaldis who were black, the ones not admixted with Neanderthals were more suited for Africa and less suited for colder regions in Europe. So presumably we have "caucasoids" invading other "caucasoids" in Europe
Posts: 42919 | From: , | Registered: Jan 2010
| IP: Logged |
posted
The other way around: The Neanders went exticnt and the Grimaldis survived and morphed into the depigmented Europeans with whom we are now familiar.
Posts: 5492 | Registered: Nov 2004
| IP: Logged |
posted
^ Correct. And let's not forget about more recent Out-of-African migrations like the Kebarans, Natufians, and neolithic forebears of Europe. Posts: 26238 | From: Atlanta, Georgia, USA | Registered: Feb 2005
| IP: Logged |
posted
^ Do try and keep up to date. The idea Natufians influenced Neolithic Europen culture has been debunked. They were a dead end culturally. Anyway they weren't even Negroid. lol.
quote:Originally posted by lamin: The other way around: The Neanders went exticnt and the Grimaldis survived and morphed into the depigmented Europeans with whom we are now familiar.
morphed = Metamorphosis
Metamorphosis is a biological process by which an animal physically develops after birth or hatching, involving a conspicuous and relatively abrupt change in the animal's body structure through cell growth and differentiation. Some insects, amphibians, molluscs, crustaceans, Cnidarians, echinoderms and tunicates undergo metamorphosis, which is usually accompanied by a change of habitat or behavior.
He,he,he:
Damn you fuchers are sad.
It's called Albinism.
It happens every day, there is nothing mysterious about it, but yet you emotionally fragile creatures can't accept it.
Out of curiosity, why is a mythical Metamorphosis over thousands of years, from Black to White, more palatable in your minds, than the normal Albino birth? In both cases you start off Black and end up White.
He,he,he:
It's really about not giving Blacks the satisfaction of being able to say that they MADE you - isn't it?
BTW - I have yet to hear the theory of how their Facial Features and Hair changed.
Albinism covers it, but lack of Vitamin "D" doesn't. Any thoughts?
Posts: 22721 | Registered: Oct 2005
| IP: Logged |
quote:Originally posted by Anglo_Pyramidologist: ^ It's been debunked.
Out of Africa = replacement model.
Genetics has disproven this. Europeans have Neanderthal genes.
Palaeoanthropologist John Hawkes, Associate Professor of Anthropology at the University of Wisconsin writes in 2010:
''These ongoing studies are concluding that present-day genetic variation is inconsistent with a simple model where a random-mating ancestral population gives rise to todays global population by means of a staged out-of-Africa dispersal''
Like i said try to keep up to date...
The only nutters still clinging to out of africa are a few black supremacists like Zaharan, Troll Patrol etc on this forum, who want all races to merely be subsets of an ''original black african'' out of their own socio-political agendas.
It's funny how a NBP-member is now going to call random black people supremacists, because we disagree with his nazi dribble. When everything he cites and mumbles is linked to extreme rightwinged groups, as far as eugenics.
Y-DNA haplogroup A contains lineages deriving from the earliest branching in the human Y chromosome tree. The oldest branching event, separating A0-P305 and A1-V161, is thought to have occurred about 140,000 years ago. Haplogroups A0-P305, A1a-M31 and A1b1a-M14 are restricted to Africa and A1b1b-M32 is nearly restricted to Africa. The haplogroup that would be named A1b2 is composed of haplogroups B through T. The internal branching of haplogroup A1-V161 into A1a-M31, A1b1, and BT (A1b2) may have occurred about 110,000 years ago. A0-P305 is found at low frequency in Central and West Africa. A1a-M31 is observed in northwestern Africans; A1b1a-M14 is seen among click language-speaking Khoisan populations. A1b1b-M32 has a wide distribution including Khoisan speaking and East African populations, and scattered members on the Arabian Peninsula.
Y-DNA haplogroup D is seen primarily in Central Asia, Southeast Asia, and in Japan and was established approximately 50,000 years ago. Sub-group D1 (D-M15) is seen in Tibet, Mongolia, Central Asia, and Southeast Asia, and the sub-groups D* (D-M174) and D3 (D-P47) are seen in Central Asia. The sub-group D2 (D-M55) is seen almost exclusively in Japan.
An isolated incidence of haplogroup D has also been seen in the Andaman Islands in the Indian Ocean. This implies that the group may once have had a much greater range, but has subsequently been displaced by more recent population events.
Y-DNA haplogroup D is seen primarily in Central Asia, Southeast Asia, and in Japan and was established approximately 50,000 years ago
quote:Originally posted by Anglo_Pyramidologist: ^ Do try and keep up to date. The idea Natufians influenced Neolithic Europen culture has been debunked. They were a dead end culturally. Anyway they weren't even Negroid. lol.
ALU INSERTION POLYMORPHISMS IN POPULATIONS OF THE SOUTH CAUCASUS
Litvinov S* et al.
Although it was not possible to determine a contribution of Neolithic farmers to the Caucasian gene pool, the principal component analysis showed clear differences between these populations and those of Europe, Siberia and Asia. No evidence of correlation between genetic and linguistic data in our populations was disclosed.
Armenians are a separate ethnic group, which originated from Neolithic tribes of the Armenian Uplands. In the 12th- 11th centuries BC...
However, we cannot exclude a Neolithic contribution to the contemporary gene pool. The possible reason for the absence of the frequency distribution gradient can be genetic drift, reinforced by isolation that could conceal the influence of Neolithic farmers on the Caucasus populations [1,21].
While an Alu insertion marker does not have enough power of resolution to assess the contribution of the influence of Neolithic farmers on the Caucasian gene pool, it clearly separates both South and North Caucasus populations (except Karanogays) from Siberian and Asian populations.
C.L. Brace (2005): "If the late Pleistocene Natufian sample from Israel is the source from which that Neolithic spread was derived, there was clearly a sub-Saharan African element present of almost equal importance as the Late Prehistoric Eurasian element."
"From the Mesolithic to the early Neolithic period different lines of evidence support an out-of-Africa Mesolithic migration to the Levant by northeastern African groups that had biological affinities with sub-Saharan populations. From a genetic point of view, several recent genetic studies have shown that sub-Sabaran genetic lineages (affiliated with the Y-chromosome PN2 clade; Underhill et al. 2001) have spread through Egypt into the Near East, the Mediterranean area, and, for some lineages, as far north as Turkey (E3b-M35 Y lineage; Cinniogclu et al. 2004; Luis et al. 2004), probably during several dispersal episodes since the Mesolithic (Cinniogelu et al. 2004; King et al. 2008; Lucotte and Mercier 2003; Luis et al. 2004; Quintana-Murci et al. 1999; Semino et al. 2004; Underhill et al. 2001). This finding is in agreement with morphological data that suggest that populations with sub-Saharan morphological elements were present in northeastern Africa, from the Paleolithic to at least the early Holocene, and diffused northward to the Levant and Anatolia beginning in the Mesolithic.
Indeed, the rare and incomplete Paleolithic to early Neolithic skeletal specimens found in Egypt - such as the 33,000-year-old Nazlet Khater specimen (Pinhasi and Semai 2000), the Wadi Kubbaniya skeleton from the late Paleolithic site in the upper Nile valley (Wendorf et al. 1986), the Qarunian (Faiyum) early Neolithic crania (Henneberg et al. 1989; Midant-Reynes 2000), and the Nabta specimen from the Neolithic Nabta Playa site in the western desert of Egypt (Henneberg et al. 1980) - show, with regard to the great African biological diversity, similarities with some of the sub-Saharan middle Paleolithic and modern sub-Saharan specimens.
This affinity pattern between ancient Egyptians and sub-Saharans has also been noticed by several other investigators (Angel 1972; Berry and Berry 1967, 1972; Keita 1995) and has been recently reinforced by the study of Brace et al. (2005), which clearly shows that the cranial morphology of prehistoric and recent northeast African populations is linked to sub-Saharan populations (Niger-Congo populations). These results support the hypothesis that some of the Paleolithic-early Holocene populations from northeast Africa were probably descendents of sub-Saharan ancestral populations...... This northward migration of northeastern African populations carrying sub-Saharan biological elements is concordant with the morphological homogeneity of the Natufian populations (Bocquentin 2003), which present morphological affinity with sub-Saharan populations (Angel 1972; Brace et al. 2005).
In addition, the Neolithic revolution was assumed to arise in the late Pleistocene Natufians and subsequently spread into Anatolia and Europe (Bar-Yosef 2002), and the first Anatolian farmers, Neolithic to Bronze Age Mediterraneans and to some degree other Neolithic-Bronze Age Europeans, show morphological affinities with the Natufians (and indirectly with sub-Saharan populations; Angel 1972; Brace et al. 2005), in concordance with a process of demie diffusion accompanying the extension of the Neolithic revolution (Cavalli-Sforza et al. 1994)."
Nature 249, 120 - 123 (10 May 1974); doi:10.1038/249120a0
Barbed bone points from Central Sudan and the age of the Early Khartoum tradition
D. ADAMSON*, J. D. CLARK & M. A. J. WILLIAMS
*School of Biological Sciences, Macquarie University, New South Wales 2113, Australia Department of Anthropology, University of California, Berkeley, California 94720 School of Earth Sciences, Macquarie University, New South Wales 2113, Australia
Barbed bone points, typical of those from the early Holocene settlement of Early Khartoum, have been found at three sites along the White Nile, south of Khartoum. The form of the fragments and the stratigraphy of the sites throw light on the environment and technology of the early settlements along this part of the Nile.
The site of Beisamoun is located in the western margins of the Hula Basin, c. 10 km south of Qiryat Shemona. A moderate Mediterranean climate and water resources in the immediate vicinity of the site, such as the Enan and Agamon springs, were one of the major factors for establishing prehistoric settlements in this region, one of which was Ein Mallaha, a major Natufian site in the Levant.
quote:Originally posted by Djehuti: ^ Correct. And let's not forget about more recent Out-of-African migrations like the Kebarans, Natufians, and neolithic forebears of Europe.
Larry Angel (1972): "one can identify Negroid traits of nose and prognathism appearing in Natufian latest hunters.(McCown, 1939) and in Anatolian and Macedonian first farmers, probably from Nubia via the predecesors of the Badarians and Tasians...
The Emergence of the Natufian
The emergence of the Natufian is explained by Bar-Yosef (1998) as follows: On the one hand, climatic improvements around 13,000BP provided a wealth of food resources. On the other hand, contemporaneous population growth in both the steppic and desertic regions made any abrupt, short-term climatic fluctuation a motivation for human groups to achieve control over resources (p.167). He sees a semi-sedentary lifestyle resulting from environmental change which led to a shift of resource scheduling (p.167).
Fellner (1995) states that the transition from the Geometric Kebaran to the Early Natufian culture can be described as the most important cultural change within the Epipalaeolithic of Palestine, as the lifestyle of the Natufian groups differed very substantially from that practiced by their Geometric Kebaran ancestors (p.122) The Natufian is usually seen as a key stage in Near Eastern Prehistory as it represents many features usually associated with the Neolithic. - courtesy of neareast historians, uk; epipaleolithic background.
The Mushabian is founded in southern Jordan, the Negev, and Sinai. It is usually divided into an earlier phase (c.14,500-12,800bp) and a later phase which overlaps with the Early Natufian (12,800-11,000bp).
The Classic Mushabian is characterized by a dominance of arched-back bladelets, La Mouillah points, and scalene triangles, all of which were truncated at one end using the microburin technique. Helwan lunates are also featured.
Evidence for economic activities are few and far between there are very few botanical or faunal remains, but some rare pounding tools suggest that plant exploitation was a feature of the economy. Bar-Yosef and Meadow (1999) hypothesize that the subsistence strategies employed in the Mushabian were much the same as those of the steppic Geometric Kebaran and Hamran groups.
The Mushabian was traditionally thought to derive from North Africa via the Nile Delta and the Sinai: The Mushabian sites in Sinai are interpreted as the remains of mobile groups budded off from the Nile region who were attracted to the expanding, lusher steppic environment (Bar-Yosef and Meadow 1999, p.55). This view was based on the early occurrence of the microburin technique in industries like the Sisilian. However, the recent discovery of even earlier use of the microburin technique in the Azraq Basin fundamentally weakens the argument, and may even indicate diffusion of this technique in the other direction (Fellner 1995, p.26). Fellner believes that the Mushabian is most likely to derive from the Nizzanian of the Negev. - courtesy of neareast historians, uk; epipaleolithic background.
Posts: 22234 | From: האם אינכם כילדי הכרית אלי בני ישראל | Registered: Nov 2010
| IP: Logged |
posted
^ Correct. And these same neolithic forebears spread from Southwest Asia into Europe along with neolithic culture.
Even today in Europe, African E lineages compose about a third of the European genetic make up.
There are some people i.e. many Euros and those of their descent who are not all happy with this like the anguished bugger. Which is why he keeps bugging me about it like the little bugger that he is, even though he pretends to be a 'black' Afrocentric. His obvious disturbance of African ancestry among he and his white kin has exposed him for another lyinass that he is. Posts: 26238 | From: Atlanta, Georgia, USA | Registered: Feb 2005
| IP: Logged |
posted
All you have to do is quote Sforza or any other study that says Europe is made up of 33% Hg E and the rest Asian. Whats taking so long? Posts: 4254 | From: dasein | Registered: Jun 2009
| IP: Logged |
quote:Originally posted by anguishofbeing: All you have to do is quote Sforza or any other study that says Europe is made up of 33% Hg E and the rest Asian. Whats taking so long?
By now we know Sforza wrote somewhat biased. It's very usual, when you follow his line of work.
Posts: 22234 | From: האם אינכם כילדי הכרית אלי בני ישראל | Registered: Nov 2010
| IP: Logged |
posted
^ Correct. Which is why to get a clear picture, you have to look at other works and studies. Sforza is right about significant African genetic influence in Europe though.
quote:Originally posted by anguishofbeingdumb: All you have to do is quote Sforza or any other study that says Europe is made up of 33% Hg E and the rest Asian. Whats taking so long?
Again you resort to distorting. Sforza specifically stated: "The overall (genetic) contributions from Asia and Africa were estimated to be around two-thirds and one-third, respectively."
His basis comes from a host of genetic data not just Y-chromosomal hg. Y-chromosomal hgs are a significant part of it. You ask where he got the samples. It's in the study. Go and read it twit, unless you think he got the samples from thin air or he made it up.
quote:Anglo_Pyramidiot wrote: E frequencies only run at 20 - 30% in Southern Europe, and around 10% in Central Europe.
Northern European they are 0%, excluding Wales 2% and Finland 1%.
The average E frequency for southern or 'Mediterranean' Europe in general is 20%. Central Europe is 10% and northern Europe is 3%. The total is 33%, hence one-third.
quote:anguishofbeingstupd wrote: Quote one scholar Mary, one scholar, that says the overall contributions of African hg in Europeans is 33% E. Just one.
Again. Read the sh*t above.
quote:Dufus, you claimed that the overall *African* contributions are 33% E, where the fuk is the rest of African contributions going to come from now if its 33% E African and the rest Asian????
Again Sfroza and others agree that the total African contribution is one-third overall (including E, though not exclusively E). As for the rest being 'Asian'. Europeans ARE Asian dumb twit and not a genetically separate entity from Asia. Europe itself is a subcontinent of Asia. This was explained to your dumb ass multiple times!
quote:This is why you have to run away now. But you will come back years later to argue the same BS only to run away when pressed. HAHAHAHHALOL
HAHAHAHHALOL Indeed! You're delusion has obviously bested you again if you think I ever "run away" from anyone let alone a jew-frightened dumb ass negrophobic loser like yourself! What I argue is not b.s. but basic fact plain and simple. That you have a problem with it is your issue.
quote:Oh yes, you have contradicted yourself several times, this is because you are desperately trying to argue one BS claim which only ends up fuking up everything else you argue. LOL!
And where have I contradicted myself asswipe?? Please explain to me how? I beg of you. Posts: 26238 | From: Atlanta, Georgia, USA | Registered: Feb 2005
| IP: Logged |
quote:You ask where he got the samples. It's in the study.
Where? You posted it, you quote it. Why is it taking so long?
quote:Again Sfroza and others agree that the total African contribution is one-third overall (including E, though not exclusively E).
So sometimes its 33% all E:"The average E frequency for southern or 'Mediterranean' Europe in general is 20%. Central Europe is 10% and northern Europe is 3%. The total is 33%, hence one-third.
and other occasions its not all E: "including E, though not exclusively E" HAHAHHAHA
You mixed up math dunce. LOL!
Posts: 4254 | From: dasein | Registered: Jun 2009
| IP: Logged |
quote:Originally posted by lamin: In the Oppenheimer map there are no migration lines within the whole African continent except the one for exit.
Given that humans originated in Africa and lived in Africa for approximately 100,000 years before migrating out of the continent--of course the migrants had no idea of anything about where they were migrating to--the migration routes within Africa would be many--much more than the routes external to Africa.
If there was only a single migratory group then the phenotypes of the Andaman Islanders and the Melanesians offer us a good idea of what the migrants looked like before being morphing to phenotypical varieties we now see in the world.
The phenotypes of the Andaman Islanders and the Melanesians would, therefore, seem to refute the claim that possible back migrations--R1, J, etc,--into Africa were people of different phenotypical appearance--unless such migrations took place very recently--i.e. post the Pharaonic Age.
Good point Lamin. There were also numerous migrations or movements of peoples WITHIN Africa due to food needs, climate, environment, shifting resource bases etc.. Furthermore even Oppenheimer's analysis seems to show that genetic differentiation was already underway WITHIN Africa before any free-roaming exits. This exposes hypocritical Eurocentric claims and labels, whereby a few black guys who wander over the Arabian late into Arabia and further east suddenly become "EUrasian", or "Middle Eastern". They love these labels because they help to deAfricanize tropical African peoples. It is part of their agenda. However even Oppenheimer's analysis notes- quote:
These observations seem to mean that, unlike the mtDNA exit, which is defined by a single branch L3, splitting outside Africa into M and N (see below), up to three Y branches (C, D and F), albeit very closely related, could have split before the initial exit from Africa, rather than after. The argument for this scenario is that the ancestor to D could not have split off after exit, from a single M168-CDF common ancestor outside Africa, leaving E behind, because D and E are both defined by YAP+ and form their own sub-clade [15].
Other scientists support a similar scenario- of early proto-lineage or lineage variant diversity before any clear pattern of exits. In other words, the people who were to become "non-African" had already developed certain gene diversity patterns. These would intensify outside of Africa the further people moved away, and appearances would change more dramatically, but all the essential foundations already were underway inside Africa, and until relatively recently these outside peoples resembled their tropical African forbears.
As for backflow, the "backflowees" would have clustered with tropical Africans to begin with.
And as to the bogus "Natufian killer" claims by "racial UNreality": that has been debunked already.
-------------------------------------------------------------------------------------------------------------------- And the resemblances of the Natufians with tropical Africans is well supported by scholarship. There was a diverse range of appearance but the clear links are well documented.
Posts: 5905 | From: The Hammer | Registered: Aug 2008
| IP: Logged |
quote:Originally posted by anguishofbeingstupid: Where? You posted it, you quote it. Why is it taking so long?
I already gave a link to the study, but since you are too stupid to read it, let alone understand it here it is: "The difference is statistically significant and is consistently found with all markers, ranging from classical ones based on gene products [blood groups and protein polymorphisms (1)] to DNA markers such as restriction polymorphisms (4) and microsatellites (5). For incompletely understood reasons, discussed later, mtDNA trees of non-African populations are not as informative as desired."
As you can see, Sforza used multiple lines of genetic evidence, including Y-DNA haplogroups.
quote:So sometimes its 33% all E:"The average E frequency for southern or 'Mediterranean' Europe in general is 20%. Central Europe is 10% and northern Europe is 3%. The total is 33%, hence one-third.
and other occasions its not all E: "including E, though not exclusively E" HAHAHHAHA
You mixed up math dunce. LOL!
The only one mixed up here is YOU! Sforza uses multiple types of genetic evidence, not only E, though E is a significant component since it is a non-recombinant uniparental trait and thus the best component used for tracing actual lineage!
My math is quite fine, but apparently your logic isn't. I just figured out what YOUR idiotic mistake is, and I'm sure the smart people in this forum has figured it out as well.
Let's go over it again. Sforza's findings show that Europeans are one-third African. Now this is backed up by multiple types of genetic evidence. Y-hg E being the best example showing 33% frequency among Europeans in general.
What do you think is wrong again?? Posts: 26238 | From: Atlanta, Georgia, USA | Registered: Feb 2005
| IP: Logged |
posted
^ You are confusing GEOGRAPHICAL admixture with racial. Setting up another logical fallacy.
Southern Europeans are 1/3 African, but they are 100% Caucasoid. Their African admixture is not Negroid, but Caucasoid.
Posts: 1575 | From: - | Registered: May 2011
| IP: Logged |
quote:Identify the samples he used to arrive at the 33%
quote:"The difference is statistically significant and is consistently found with all markers, ranging from classical ones based on gene products [blood groups and protein polymorphisms (1)] to DNA markers such as restriction polymorphisms (4) and microsatellites (5). For incompletely understood reasons, discussed later, mtDNA trees of non-African populations are not as informative as desired."As you can see, Sforza used multiple lines of genetic evidence, including Y-DNA haplogroups.
LOL!!! Where did he get the genetic evidence from, dufus? From aliens, dogs (your daily cuisine ), ducks? You know exactly what I'm asking for, rasol reloaded, and you know why you can't post it.
quote:Let's go over it again. Sforza's findings show that Europeans are one-third African. Now this is backed up by multiple types of genetic evidence. Y-hg E being the best example showing 33% frequency among Europeans in general.
Is it all 33% Hg E or not fool. Cannot be all one-third hg E (The average E frequency ... total is 33%, hence one-third.) and "not exclusively E" at the same time. Jackass.
Posts: 4254 | From: dasein | Registered: Jun 2009
| IP: Logged |
quote:LOL!!! Where did he get the genetic evidence from, dufus? From aliens, dogs (your daily cuisine ), ducks? You know exactly what I'm asking for, rasol reloaded, and you know why you can't post it.
He got it from human beings idiot! WTF kind of question is that?! How else do you get genetic data on human populations, wap?!
quote:Is it all 33% Hg E or not fool. Cannot be all one-third hg E (The average E frequency ... total is 33%, hence one-third.) and "not exclusively E" at the same time. Jackass.
Moron. The 33% Hg E I did not cite from Sforza but from the source your cohort pyrammidiot cited here! The results completely fit with Sfroza's findings that Europeans are one-third African! Quit distorting my posts, because it ain't helping your long lost arguments, dummy!! Posts: 26238 | From: Atlanta, Georgia, USA | Registered: Feb 2005
| IP: Logged |
quote:LOL!!! Where did he get the genetic evidence from, dufus? From aliens, dogs (your daily cuisine ), ducks? You know exactly what I'm asking for, rasol reloaded, and you know why you can't post it.
He got it from human beings idiot! WTF kind of question is that?! How else do you get genetic data on human populations, wap?!
quote:Is it all 33% Hg E or not fool. Cannot be all one-third hg E (The average E frequency ... total is 33%, hence one-third.) and "not exclusively E" at the same time. Jackass.
Moron. The 33% Hg E I did not cite from Sforza but from the source your cohort pyrammidiot cited here! The results completely fit with Sfroza's findings that Europeans are one-third African! Quit distorting my posts, because it ain't helping your long lost arguments, dummy!!
No samples, no proof for your "Europeans are made up of 33% African Hg E - and not exclusively E". LOLOL Epic fail again. Damn fool how many times you repeated the fifth grade?! lol
1. site the samples for Sforza's fractions or STFU.
2. In terms of the "over all African contributions", Europeans cannot be made up of 33% Hg E - and not exclusively E.
quote:Originally posted by anguishofbeingstupidasfuck: No samples, no proof for your "Europeans are made up of 33% African Hg E - and not exclusively E". LOLOL Epic fail again. Damn fool how many times you repeated the fifth grade?! lol
LMAO You are truly mad (crazy as you are angry)! How can there be no genetic samples for Sforza to come to his conclusion??!
In fact why do you keep asking me such dumbass questions when it's all in the study here.
If your literate enough to read my posts, I take it you can read the paper for yourself.
quote:1. site the samples for Sforza's fractions or STFU.
I just did, dummy!
"There is one important exception to the rule in Table 1, namely that in the first column of the matrix Europe shows a shorter distance from Africa than do all the other continents. The difference is statistically significant and is consistently found with all markers, ranging from classical ones based on gene products [blood groups and protein polymorphisms (1)] to DNA markers such as restriction polymorphisms (4) and microsatellites (5). For incompletely understood reasons, discussed later, mtDNA trees of non-African populations are not as informative as desired."
quote:2. In terms of the "over all African contributions", Europeans cannot be made up of 33% Hg E - and not exclusively E.
Yeah! It's perfectly logical, dumbfuck! Africans can't just contribute their Y-chromosomes alone without other chromosomes and genes, dummy! That's why E is not exclusive though it is still a major component or line of genetic evidence!! LOL Y haplogroups are based on SNP which replaced the older restriction polymorphisms used in Sforza's study but are highly correlated with microsatellites used in the study. Though you also have blood groups like HBS and protein polymorphisms like HLA. Each one shows African affinities in Europeans!
It's perfectly logical and sound to anyone with a well functioning brain. I guess that leaves you out.
Posts: 26238 | From: Atlanta, Georgia, USA | Registered: Feb 2005
| IP: Logged |
posted
^ Please do tell us how you went from equating African to ''Black'' when North Africans are not Negroid.
Posts: 1575 | From: - | Registered: May 2011
| IP: Logged |
No you didn't, dufus. Which African sample did he use, an Asante, Beja, Khoisan, Pygmy who did he use?
Bowcock (1991) study (including Sforza) same percentages two-thirds and one-third. Samples identified: African-Pygmy, Asian-Chinese.
Where are the samples for your fractions loser? You can't post them because you know they are from the same study. Born loser
quote:Yeah! It's perfectly logical, dumbfuck! Africans can't just contribute their Y-chromosomes alone without other chromosomes and genes, dummy! That's why E is not exclusive though it is still a major component or line of genetic evidence!!
LOL! What a perfect jackass you are. You say the 33% of African contributions are all Hg. E, and not all Hg E.
posted
^ Desperate bugger is spinning around in circles while quoting Bowcock (I know you just can't get cock out of your mind let alone outta your mouth ). I'm not quoting Bowcock but Sforza. His Europeans samples were compared to those from Asia and Africa. It shows Euros are essentially Asians but with some African admixture, one-third to be exact.
As for illogic. Again, I'm sorry I can't help you in understanding simple English. Sforzas assessments were based on restriction polymorphisms and microsatellites among other things, and they show one-third contribution. Later studies including the Y-hg study posted by pyramidiot here shows African E lineages at around 33% which CONFIRM Sforza.
Face it, you white british batty boy, your Euro people have African ancestry, especially 'Mediterraneans'. Posts: 26238 | From: Atlanta, Georgia, USA | Registered: Feb 2005
| IP: Logged |
No dummy, you are quoting Bowcock, you're just too stupid to realize. The fractions you keep mindlessly spamming are not from that study Genes, peoples, and languages. He identifies which study he is referring to, "Moreover, a specific evolutionary model tested, i.e., that Europe is formed by contributions from Asia and Africa, fits the distance matrix perfectly [(6) Bowcock 1991 ]. In *this* simplified model, the migrations postulated to have populated Europe are estimated to have occurred at an early date (30,000 years ago), but it is impossible to distinguish, on the basis of these data, this model from that of several migrations at different times. The overall contributions from Asia and Africa were estimated to be around two-thirds and one-third, respectively."
Its from Bowcock, you self-defeating jackass. lol
quote:As for illogic.
Yes, due to your four year desperation thats where you will LOGICALLY end up.
Can't be all 33% Hg E and not all E at the same time. That is:
quote:Originally posted by anguishofbeingdumb&illiterate: No dummy, you are quoting Bowcock, you're just too stupid to realize. The fractions you keep mindlessly spamming are not from that study Genes, peoples, and languages. He identifies which study he is referring to, "Moreover, a specific evolutionary model tested, i.e., that Europe is formed by contributions from Asia and Africa, fits the distance matrix perfectly [(6) Bowcock 1991 ]. In *this* simplified model, the migrations postulated to have populated Europe are estimated to have occurred at an early date (30,000 years ago), but it is impossible to distinguish, on the basis of these data, this model from that of several migrations at different times. The overall contributions from Asia and Africa were estimated to be around two-thirds and one-third, respectively."
Its from Bowcock, you self-defeating jackass. lol
LMAO Yes, in the above passage you cited, Sforza makes reference to Bowcock, however he points out how Bowcock's model is siplistic because it assumes the genetic contributions occurred at the same time i.e. the initial settling of Europe, however Bowcock was not able to utilize the genetic techniques available to Sfroza. The same techniques confirm that Europeans are one-third African and is confirmed again by the data posted by pyramidiot here: http://www.eupedia.com/europe/european_y-dna_haplogroups.shtml
Bowcock's premise made no sense because it assumed the genetic contributions occurred at the same time. Sfroza and other experts show that the one-third African contribution came MUCH LATER after Europe was settled and thus 'mixed' NOT that these African genetics were part of ancestral Europeans!
quote:Yes, due to your four year desperation thats where you will LOGICALLY end up.
Can't be all 33% Hg E and not all E at the same time. That is:
[/QB]
No dummy, because hg E is not the only genetic contribution, nitwit. Perfectly logical to anyone with brains. Posts: 26238 | From: Atlanta, Georgia, USA | Registered: Feb 2005
| IP: Logged |
Man get the fuk outta here with your sockpuppet Angolo pyramidologist-spammed BS, you desperate jackass! LOL
Recap:
The fractions you keep spamming are from Bowcock, I already school your dumbass along with rasol et al. about what Keita had to say about studies of that nature. After all your evasions you come right back to where you were desperately trying to avoid.
quote:because hg E is not the only genetic contribution
You said it was the only one. The total African contribution is 33% and you said it was all Hg. E. Work it out fool, nothing is left if it's 33% Hg E. You are a fuking math dunce. LOL
Posts: 4254 | From: dasein | Registered: Jun 2009
| IP: Logged |


 UBBFriend: Email this page to someone!


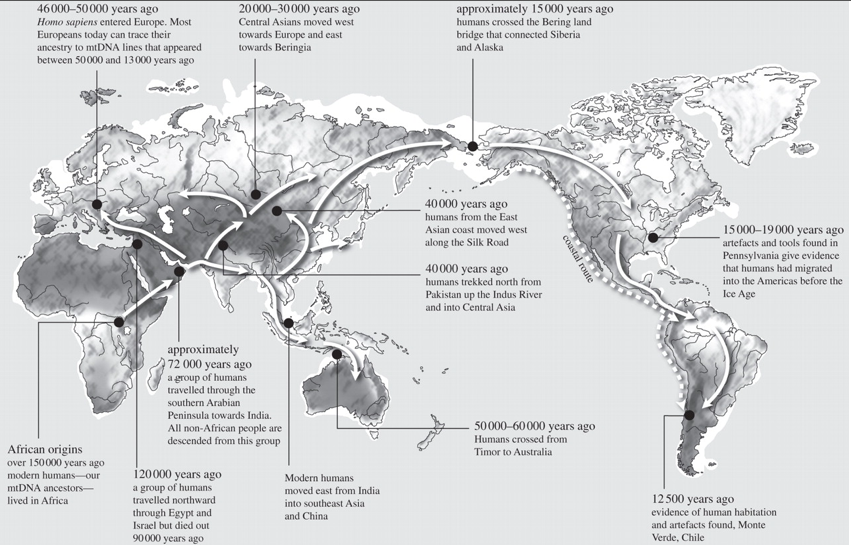
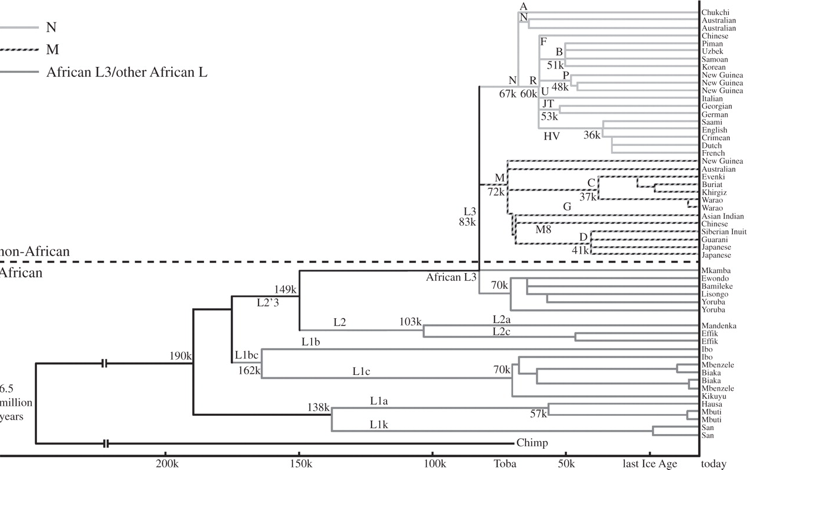

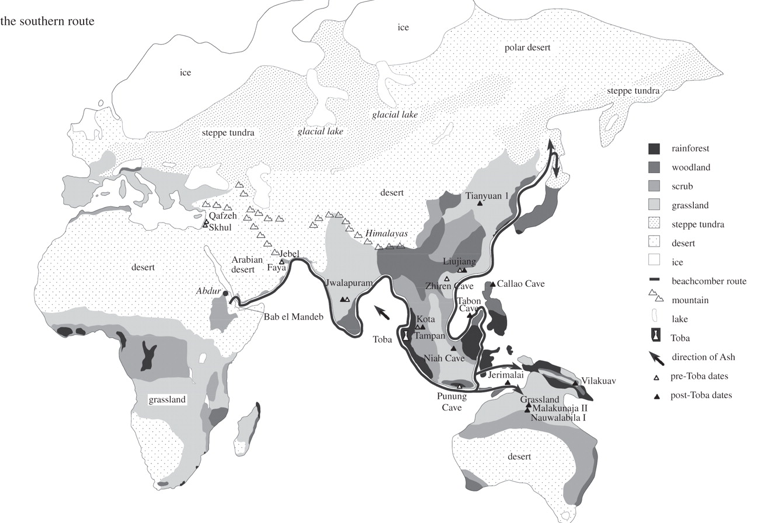
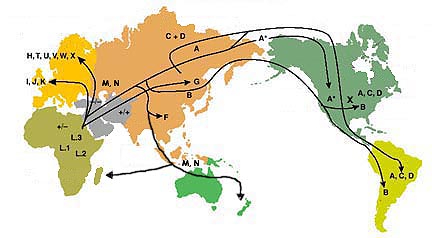


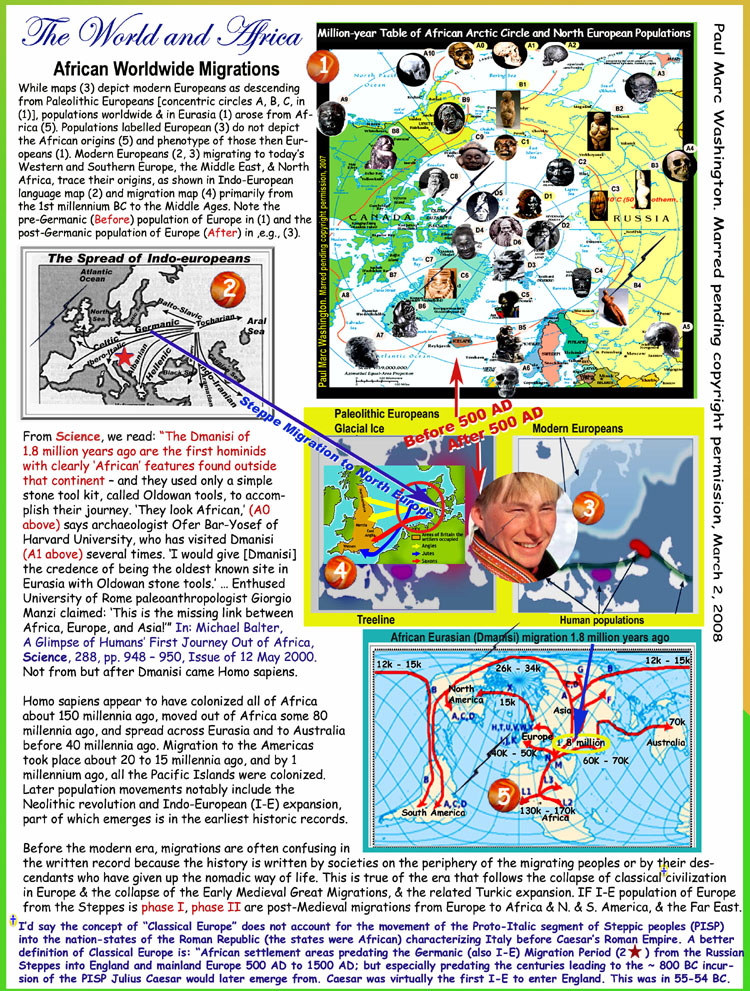

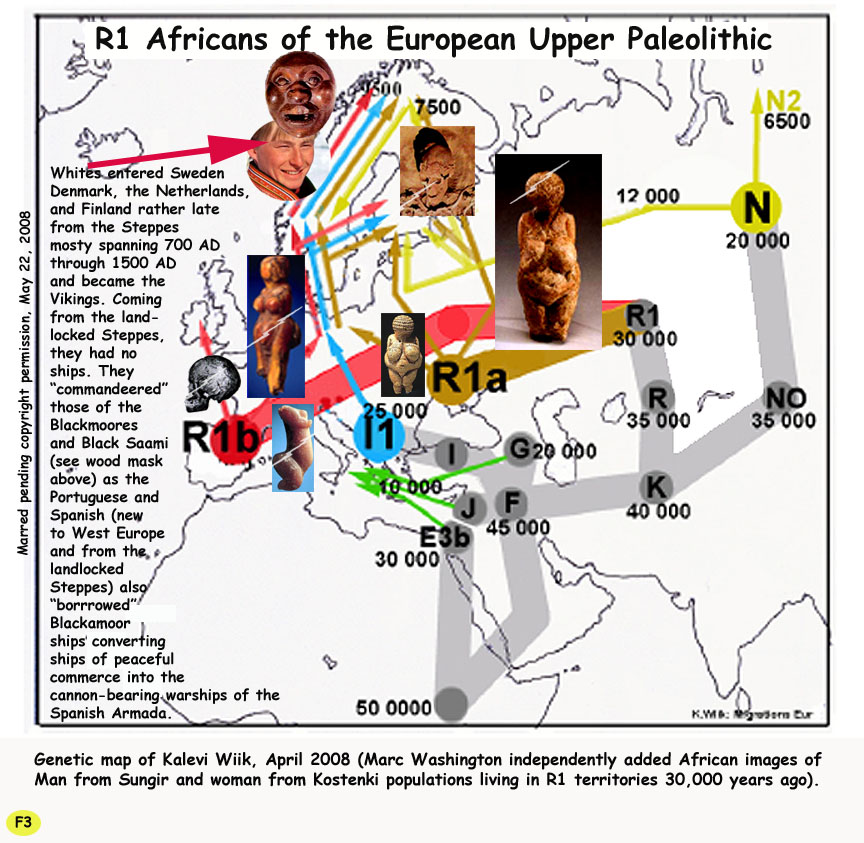
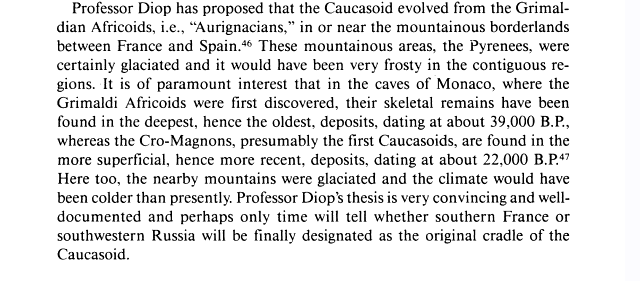
![[Wink]](wink.gif)


![[Cool]](cool.gif)
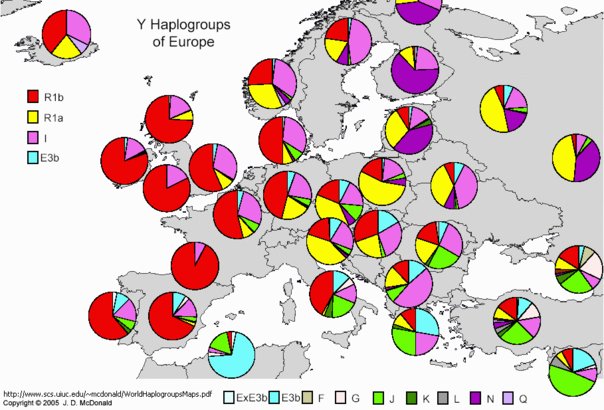
![[Confused]](confused.gif)
![[Roll Eyes]](rolleyes.gif)
![[Big Grin]](biggrin.gif) Indeed! You're delusion has obviously bested you again if you think I ever "run away" from anyone let alone a jew-frightened dumb ass negrophobic loser like yourself! What I argue is not b.s. but basic fact plain and simple. That you have a problem with it is your issue.
Indeed! You're delusion has obviously bested you again if you think I ever "run away" from anyone let alone a jew-frightened dumb ass negrophobic loser like yourself! What I argue is not b.s. but basic fact plain and simple. That you have a problem with it is your issue.


![[Eek!]](eek.gif) The only one mixed up here is YOU! Sforza uses multiple types of genetic evidence, not only E, though E is a significant component since it is a non-recombinant uniparental trait and thus the best component used for tracing actual lineage!
The only one mixed up here is YOU! Sforza uses multiple types of genetic evidence, not only E, though E is a significant component since it is a non-recombinant uniparental trait and thus the best component used for tracing actual lineage! LOL!!! Where did he get the genetic evidence from, dufus? From aliens, dogs (your daily cuisine

![[Razz]](tongue.gif)


![[Embarrassed]](redface.gif)


 Printer-friendly view of this topic