Genomic Ancestry of North Africans Supports Back-to-Africa Migrations Brenna M. Henn equal contributor,
Laura R. Botigué equal contributor,
Simon Gravel,
Wei Wang,
Abra Brisbin,
Jake K. Byrnes,
Karima Fadhlaoui-Zid,
Pierre A. Zalloua,
Abstract
North African populations are distinct from sub-Saharan Africans based on cultural, linguistic, and phenotypic attributes; however, the time and the extent of genetic divergence between populations north and south of the Sahara remain poorly understood. Here, we interrogate the multilayered history of North Africa by characterizing the effect of hypothesized migrations from the Near East, Europe, and sub-Saharan Africa on current genetic diversity. We present dense, genome-wide SNP genotyping array data [730,000 sites] from seven North African populations, spanning from Egypt to Morocco, and one Spanish population. We identify a gradient of likely autochthonous Maghrebi ancestry that increases from east to west across northern Africa; this ancestry is likely derived from back-to-Africa gene flow more than 12,000 years ago [ya], prior to the Holocene. The indigenous North African ancestry is more frequent in populations with historical Berber ethnicity. In most North African populations we also see substantial shared ancestry with the Near East, and to a lesser extent sub-Saharan Africa and Europe. To estimate the time of migration from sub-Saharan populations into North Africa, we implement a maximum likelihood dating method based on the distribution of migrant tracts. In order to first identify migrant tracts, we assign local ancestry to haplotypes using a novel, principal component-based analysis of three ancestral populations. We estimate that a migration of western African origin into Morocco began about 40 generations ago [approximately 1,200 ya]; a migration of individuals with Nilotic ancestry into Egypt occurred about 25 generations ago [approximately 750 ya]. Our genomic data reveal an extraordinarily complex history of migrations, involving at least five ancestral populations, into North Africa.
Author Summary
Proposed migrations between North Africa and neighboring regions have included Paleolithic gene flow from the Near East, an Arabic migration across the whole of North Africa 1,400 years ago [ya], and trans-Saharan transport of slaves from sub-Saharan Africa. Historical records, archaeology, and mitochondrial and Y-chromosome DNA have been marshaled in support of one theory or another, but there is little consensus regarding the overall genetic background of North African populations or their origin and expansion. We characterize the patterns of genetic variation in North Africa using ~730,000 single nucleotide polymorphisms from across the genome for seven populations. We observe two distinct, opposite gradients of ancestry: an east-to-west increase in likely autochthonous North African ancestry and an east-to-west decrease in likely Near Eastern Arabic ancestry. The indigenous North African ancestry may have been more common in Berber populations and appears most closely related to populations outside of Africa, but divergence between Maghrebi peoples and Near Eastern/Europeans likely precedes the Holocene [>12,000 ya]. We also find significant signatures of sub-Saharan African ancestry that vary substantially among populations. These sub-Saharan ancestries appear to be a recent introduction into North African populations, dating to about 1,200 years ago in southern Morocco and about 750 years ago into Egypt, possibly reflecting the patterns of the trans-Saharan slave trade that occurred during this period.
Introduction
The census size of Mediterranean North Africa exceeds 160 million people [1], but relatively little is known about the genetic makeup of these populations and the demographic history of migration between North Africa and neighboring regions. Mediterranean North Africans are often grouped with Near Eastern populations because populations in both regions speak primarily Afro-Asiatic languages, like Arabic, and phenotypic attributes, like lighter skin pigmentation, differentiate many North Africans from sub-Saharan Africans. Recently, geneticists have attempted to replicate disease associations identified in Europeans and Near Eastern groups with North African populations, reflecting a hypothesis of shared genetic ancestry, with mixed results [2][5]. In this paper, we present analysis of autosomal single nucleotide polymorphism [SNP] array data for seven North African populations [see Materials and Methods], distributed along an east-to-west transect across the continent. We clarify the population structure of North Africa and explicitly interrogate the history of gene flow into North Africa from the Near East, Europe and sub-Saharan Africa.
Prior genetic studies, largely from uniparentally inherited markers, have not resolved the location origin of North African populations or the timing of human dispersal[s] into North Africa. Analyses based on the frequencies of a small number of autosomal genetic polymorphisms and uniparental markers have shown that the genetic landscape follow an east-west pattern with little to no difference between Berber- and Arab-speaking populations [6], [7]. Mitochondrial data, for example, indicate an early back-to-Africa migration [8][10], but Y-chromosome markers largely support a Neolithic expansion and historic period gene flow throughout the Mediterranean [11] [though see [12]]. Do current North Africans retain genetic continuity with the first modern human occupants of northern Africa from more than 50,000 years ago [ya] or was northern Africa primarily repopulated during the Holocene by herding and farming populations from elsewhere? Evidence of Neolithic migration from the Near East is supported by the introduction of domestic animals like cows, sheep and goats to North Africa. But the indigenous development of ceramics in Saharan Africa by 9,000 ya is also suggestive of an incipient form of agriculture or pastoralism, prior to any demic diffusion from the Near East [13].
Less controversial is the observation that many North African populations now speak Arabic and that this language shift occurred primarily after the Arabic conquest 1,400 ya. This Arabic shift is well documented, but it remains unknown how deeply recent migrations [<2,000 ya] from the Arabian and Iberian Peninsulas shaped the genetic diversity of current North African populations. In addition, sub-Saharan influence has been detected in North African samples by all types of genetic markers analyzed, although it is unknown how recent this gene flow might have been [14][16]. Initial autosomal SNP analysis of the Algerian Mozabites indicated they carry ancestry from Europe, the Near East and sub-Saharan Africa; neighbor-joining phylogenetic analysis suggested that Mozabites branch off with Out-of-African populations, but are an outgroup to all Near Eastern populations in the Human Genome Diversity Panel [HGDP-CEPH] [17]. In short, the origins of North African populations and the number of subsequent migrations from neighboring regions have been poorly resolved.
Genomic models of admixture in human populations have largely been confined to cases of two-way admixture such as African-American [18][20] and some Hispanic-Latino groups such as Mexican-Americans [21][23]. However, a two-population model is likely inappropriate for North African populations [as it is for some Caribbean groups such as Puerto Ricans [24]] given multiple putative migrations proposed in earlier studies. Moreover, while African-Americans and Hispanic/Latino have ancestries from highly divergent source populations, North Africans may have ancestry from more closely related populations, for example Europeans and Near Easterners. We extend a principal component analysis-based [PCA] method of local ancestry assignment [20] in order to allow for three possible ancestral populations. With haplotypes for various ancestries inferred from PCA-based assignment, we model the time and mode of migrations from neighboring regions into North Africa.
Results
Population Structure across North Africa
In order to characterize population structure across North Africa, we combined our genotype data for the seven North African populations with population samples from western Africa, eastern Africa, Europe and the Near East [see Materials and Methods]. A representative subset of these samples is displayed in Figure 1 and Figure 2. We applied both classic multidimensional scaling [MDS] with an LD-reduced set of 280 K SNPs on the identity by state [IBS] matrix and an unsupervised clustering algorithm, ADMIXTURE [25], to explore patterns of population structure. In ADMIXTURE, we explored k = 2 through 10 ancestral populations to investigate how assumptions regarding k impact our inference of population structure in North Africa. Log likelihoods for successively increasing levels of k continue to increase substantially as k increases [Figure S1B]. However, visualization of k = 10 indicates that very high order clusters pulled out related individuals in the Tunisian Berber sample [Figure S1]; for this reason we focus on k = 2 through 8.
Our North African population samples are clearly differentiated from other African populations [Figure 1, Figure 2]. MDS component 1 separates sub-Saharan Africans from populations that currently reside outside of Africa [OOA], and the North African populations cluster closest to the Near Eastern Qatari. A subset of individuals are intermediate between the North and sub-Saharan African samples [Figure 2, Figure S2]. At k = 2 [ADMIXTURE], 80% of the ancestry in North African individuals is assigned to a cluster defined by its maximum frequency in Near Eastern and European populations [Figure 1]. MDS component 2 differentiates western from eastern sub-Saharan Africans [Figure 2A]. MDS component 3 differentiates populations thought to have a high degree of autochthonous ancestry [i.e. Tunisian Berbers and Saharawi] from populations outside of Africa. Interestingly, the MDS component 3 appears to be largely independent of the amount of sub-Saharan ancestry [Figure 2B] and North Africans are dispersed along the MDS component 3 axis, with the Tunisian Berbers occupying the extreme end of this gradient.
A gradient also appears in the higher k ancestral population plots of the ADMIXTURE analysis [Figure 1]. Assuming 4 or more ancestral populations [k = 4 through 10, Figure S1] there is a cline of putative autochthonous North African ancestry decreasing in frequency from Western Sahara eastward to Egypt. We refer to this North African ancestral component as the Maghrebi throughout the remainder of the paper, reflecting the primary geographic distribution of this ancestry in the Maghreb: West Sahara, Morocco, Algeria and Tunisia. The west-to-east decline in Maghrebi assignment is only interrupted by the Tunisian Berbers, who are assigned nearly 100% Maghrebi ancestry. The Tunisian Berbers further separate as a distinct population cluster at k = 8. An opposite cline of ancestry appears to originate in the Near East [i.e. Qatari Arabs] and decreases into Egypt and westward across North Africa [k = 6, 8].
At k = 6 through 8, all North African populations except for Tunisians have sub-Saharan ancestry, present in most individuals, though this ancestry varies between 1%55%. Interestingly, eastern populations [i.e. Libya and Egypt] share ancestry assigned to both the Bantu-speaking Luhya and the Nilotic-speaking Maasai, whereas western populations share ancestry mainly with the Luhya. Of note is that the South Moroccan and western Saharan populations contain considerable variation across individuals in the amount of sub-Saharan ancestry [see also [14], [26]], consistent with recent admixture.
Divergence between North Africans and Neighboring Populations
We estimate Fst by comparing each of the North African populations to the Tuscans and Qatari respectively. Estimates range between 0.0350.063 [Figure 3]. In order to quantify population divergence among these groups, we use the relationship between Fst and the effective size Ne to estimate the divergence time t [see Materials and Methods]. Since this model neglects migration, we expect our results to form a lower bound on the population divergence time, as similar levels of population divergence would require a longer separation in the presence of migration. Additionally, the model assumes that populations have had similar demographic histories [i.e. if there was a bottleneck, all populations were affected equally]; as all populations derive the majority of their ancestry from an Out-of-Africa ancestral population, and the OOA bottleneck is the primary signature in OOA populations, we believe this assumption is valid. Estimates for population Ne were taken from Li et al. [17]. All estimates of population divergence between the North Africans and the European/Near Eastern samples predate the Holocene. We then attempted to obtain more accurate estimates of divergence time by controlling for recent migration. We calculated a second set of Fst estimates using cluster-based allele frequencies from ADMIXTURE among the Maghrebi, European and Near Eastern ancestries, when we considered higher order k = 5:8 ancestral clusters. As indicated in Figure 3, population divergence between the Maghrebi and the European and Near Eastern populations occurred between 18,00038,000 ya. The bounds here represent variation in ancestral k estimates and assumptions regarding Ne, as Near Eastern populations have a greater estimated Ne than European. Although these divergence time estimates may not be precise, as they do not adequately model ancient migration, they do suggest that the population divergence between the ancestral Maghrebi population and neighboring Mediterranean populations occurred at least 12,000 ya and indeed more likely predated even the Last Glacial Maximum.
Within Population History
Given the complex patterns of admixture apparent from population structure analyses, we asked if populations differed in the proportion of DNA that individuals within populations shared identically. We estimate the amount of DNA shared identically by descent [IBD] using the GERMLINE software [27], with a 5 cM threshold to eliminate false positive IBD matches. The estimated cumulative amount of IBD between pairs of individuals within each population is illustrated in Figure 4 with the Tunisians, Saharawi, and North Moroccans. Most of our North African populations shared little IBD or displayed an exponential-like decline in the cumulative amount of IBD, indicating that the great majority of individuals in these populations were only distantly related [i.e. had less IBD than predicted in third cousins]. However, the Tunisian Berber population displayed an excess of pairs of individuals sharing 2001200 cM IBD. This bimodal distribution indicates that many 1st and 2nd cousin genetic equivalent pairs were present in this sample, even though donors declared themselves to be unrelated during the sampling process. Analysis of long runs of homozygosity [ROH] indicate that the Tunisian population averaged almost twice as much of their genome is in ROH than other North African populations, 230 Kb versus 120 Kb respectively [Figure S3]. The pattern of ROH and pairwise IBD in the Tunisian Berbers is likely the result of endogamy due to geographic isolation or cultural marriage preferences. Local Ancestry Assignment across the Genome
Our cluster-based analysis identified five distinct ancestries in North Africa that we refer to as: Maghrebi, European, Near Eastern, eastern and western sub-Saharan Africa. In order to test whether sub-Saharan African ancestry was an ancient or recent migration signature, we considered the length of sub-Saharan haplotypes. First, to assign local, ancestry-specific haplotypes across a genome, we implemented a new principal component-based admixture deconvolution approach [PCADMIX] for three ancestral populations [see Materials and Methods, Figure S4] [20], [28]. We focus on admixed populations at either end of North Africa, specifically our population samples of South Moroccans and Egyptians.
PCADMIX requires predefined ancestral groups. For this purpose, we assume South Moroccans have ancestry from three primary sources: Maghrebi ancestry [e.g. Saharawi], eastern Bantu-speakers [e.g. Luhya] and European [e.g. Spanish Basque] [Figure 5A]. We similarly assume Egyptians have ancestry from four primary source populations: Maghrebi [e.g. Saharawi], eastern Nilotic-speakers [e.g. Maasai], Near Eastern Arabs [e.g. Qatari] and European [e.g. Spanish Basque]. These source populations reflect the ancestry assigned in our clustering algorithm analysis [Figure 1]. According to our ADMIXTURE results, two distinct sub-Saharan ancestries are present in Egyptian individuals at k = 6:10; these two ancestry components are highest in the Kenyan Luhya and Maasai populations. However, the Luhya ancestry is present at very low proportions, below 10% at k = 6 and below 5% at k = 8 and there is also Luhya ancestry detectable in Maasai populations. Thus, we chose the Maasai as the best ancestral sub-Saharan population for extant Egyptians. If our choice of source populations for an admixed individual is accurate [i.e. the source populations are reasonable representatives of an ancestral population] we expect similar estimates of ancestry proportions between PCADMIX-ADMIXTURE when ancestry in PCADMIX is assigned with a posterior probability threshold of 0.8 [, Figure 5, Figure S5]. We used the Saharawi as our proxy Maghrebi population, since the high relatedness in the Tunisian samples is likely to cause reduced ability to infer Maghrebi tracts in more diverse populations. Our sample of Tunisian Berbers retains the highest amount of Maghrebi ancestry, without substantial evidence of admixture with sub-Saharan, European or Near Eastern populations. However, their bimodal mean IBD distribution [Figure 4A] indicates a high proportion of 1st2nd cousin equivalents and suggest that our sample of Tunisian Berbers comes from an isolated, endogamous population with diversity that is likely reduced relative to other Maghrebi populations. Thus, although their low degree of non-Maghrebi admixture might make them ideal as a Maghrebi source population, reduced haplotypic diversity means that we are likely to under-call true Maghrebi segments from other, more diverse populations. This expectation was borne out in our PCA-based admixture deconvolution of southern Moroccans when comparing Tunisian versus Saharawi as a Maghrebi source population [Figure S6]. We note that when using either the Tunisian Berbers or the Saharawi, the Maghrebi component in other individuals [e.g. Egyptian, South Moroccan] tended to be underestimated in comparison to the ADMIXTURE proportions [Figure 5A, Table S2]. We also infer independent admixture proportions in the Algerian, South Moroccan and Saharawi samples by running LAMP [29] to estimate local ancestry using 3 source populations: Tunisians, Basque and Luhya; with LAMP we also observe a likely excess of inferred European ancestry in the Algerian, South Moroccan and Saharawi samples [7].
Migration Parameters
The length of tracts assigned to distinct ancestries in an individual is informative regarding the time and mode of migration from one ancestral population into another. After a migrant chromosome enters a population, the length of the migrant ancestry tract is broken down over time due to the process of recombination. We use a maximum likelihood approach developed by Pool and Nielsen [30] to estimate the time of change in migration rate between populations based on the length and number of migrant tracts in the absorbing sink [or admixed] population.
We first consider a continuous migration model where migration occurs at a constant rate from T generations ago to present day. We assume that there has been no migration between the source and sink populations prior to the initial time of a migration into the admixed population. We tabulate the number of migrant tracts in the Moroccans and Egyptians, where each migrant tract has a posterior probability >0.8. To reduce biases due to our lower sensitivity to short tracts, we only modeled tracts longer than 3 cM, and considered assigned tracts with posterior probability >0.8. With a 3 cM cutoff we expect to capture 50% of tracts from 55 generations ago and 10% of tracts from 130 generations ago [see Materials and Methods]. Unassigned short tracts [i.e. the undecided regions, Figure 5B and Figure 6] within a long continuous migrant segment can be artificially shortened by spikes of low posterior probability. Unassigned tracts that were situated within a tract of one ancestry and which maintained a posterior probability >0.5 for the same neighboring ancestry were considered to as one long ancestry tract.
We focus on the sub-Saharan African migrant tracts in South Moroccans [Figure 5B] and Egyptians [Figure 6]. These tracts tend to be highly diverged from other ancestries in the population [Fst>0.10] and populations with similar divergence resulted in accurate haplotype assignment in prior testing [28]. Under a model of constant migration from the Bantu-speaking Kenyans and southern Moroccans started about 41 generations ago [ga] [95% CI: 3944ga] assuming there was no migration occurring prior to this period. The confidence interval calculations, obtained by resampling sub-Saharan migrant tracts with replacement, do not take into account possible biases caused, for example, by the model assumption of a fixed migration rate.
Constant Versus Episodic Migration
We hypothesized that the distribution of sub-Saharan African tracts in the Moroccans and Egyptians might better reflect a single episode or pulse of migration. In order to test this hypothesis, we modify Pool and Nielsen's [30] approach to conform to a pulse model [see Materials and Methods]. We compared the log likelihoods summed over all migrant tracts under constant and pulse migration models for each population maximized over the relevant parameters, and present the model with the higher log likelihood [Table 1]. Estimates of the time of migration are more recent under a pulse model. The younger estimate occurs because the model fit must account for relatively long migrant tracts in the data; under a constant migration model these tracts represent recent migrants, but for a single episode of migration, long tracts can only be accounted for by recent migration of the entire sample. In order for the average migrant tract length to be equal in the two models, migration must have started more than twice as long ago in the constant migration model compared to the pulse model [Table 1]. Our Egyptian sample of Nilotic segments [derived from Maasai] has a better log likelihood under a pulse migration model, estimated as time since admixture of 24ga [95% CI: 2326ga] rather than 51ga under a constant migration model [Table 1].
Discussion
Out of Africa and Back Again?
By sampling multiple populations along an approximate transect across North Africa, we were able to identify gradients in ancestry along an east-west axis [Figure 1 and Figure 2]. Notably, even northwestern populations with very high proportions of Maghrebi ancestry, such as the Tunisians and Saharawi, still cluster with Out-of-Africa populations in the population structure analyses [Figure 1 [k = 2], Figure 2]. This observation of clustering formed the basis for further analyses to distinguish between two alternative demographic models. First, North Africans could be closer to OOA populations due to extensive gene flow, likely from the Near East, over the past ~50 Kya. Second, North Africans could be closer to OOA populations if the two groups had diverged more recently than either had split with sub-Saharan Africans.
We can reject a simple model of long-term continuous gene flow between the Near East and North Africa, as evidenced by clear geographic structure and non-zero Fst estimates. Fst estimates between the inferred Maghrebi cluster and sub-Saharan Africans are two to three-times greater than Fst between the Maghrebi and Europeans/Near Easterners ancestral clusters [Table S3]. We then address whether this population structure was recent or ancient. Although Fst estimates from ascertained data may be biased, as rare alleles are under-represented in the site frequency spectrum, comparison of African-European Fst from resequencing data and the Affymetrix 500 K platform showed only a negligible difference [31]. Assuming reasonable effective population sizes for North African Maghrebi and neighboring populations [17], we first showed that all North African populations are estimated to have diverged from OOA groups more than 12,000 ya [Figure 3]. After accounting for putative recent admixture [Figure 1], the indigenous Maghrebi component [k-based] is estimated to have diverged from Near Eastern/Europeans between 1838 Kya [Figure 3], under a range of Ne and k values. We hence suggest that the ancestral Maghrebi population separated from Near Eastern/Europeans prior to the Holocene, and that the Maghrebi populations do not represent a large-scale demic diffusion of agropastoralists from the Near East.
With model parameters for divergence approximately estimated, we then ask whether North African ancestral populations were part of the initial OOA exit and then returned to Africa [8], or if an in situ model of population persistence for the past 50 Kya is more likely [with variable episodes of migration from the Near East]? We can address this question only indirectly with contemporary samples; however, several auxiliary observations point toward the former hypothesis. Substantially elevated linkage disequilibrium in all of these North African population samples, compared to sub-Saharan populations [32], is consistent with a population bottleneck. Hellenthal et al. [30] also observed that the reduction in the number of haplotype founders required to reconstruct the Mozabite population, as compared to other African populations, could be explained by a population bottleneck. If North African ancestral populations persisted in situ, then we need to invoke two population bottlenecks, one in the ancestors of North Africans [including the Berbers] and one for OOA groups. Alternatively, the OOA bottleneck would need to occur in North Africa, rather than when groups moved out of the continent [33]. The second possibility appears at odds with most published models of the movement of modern humans outside of Africa.
A scenario where North African Maghrebi ancestry is the result of in situ population absorbing Near Eastern migrants would likely need the following premises to explain the results here and elsewhere: a] an Out-of-Africa migration [concurrent with bottleneck] occurs 5060 Kya, geographically dividing North African and Near Eastern populations; b] North Africans experience a separate bottleneck; c] gene flow maintains similarity between the two geographically distinct populations; d] the gene flow then ceases or slows roughly between 1240 Kya in order to allow sufficiently distinct allele frequency distributions to form. In contrast, we find it more parsimonious to describe model where: a] an OOA migration occurs [concurrent with a bottleneck]; b] OOA populations and North Africans diverge between 1240 Kya when a migration back-to-Africa occurs. These models should be further tested with genomic sequence data, which have better power to detect magnitude and timing of bottlenecks, and to estimate the true joint allele frequency spectrum.
More recently, the substantial, east-to-west decline of Near Eastern ancestry [Figure 1A] could represent a defined migration associated with Arab conquest 1,400 ya or merely gene flow occurring gradually among neighboring populations along a North African | Arabian Peninsula transect. Although we observe a declining amount of Maghrebi ancestry from northwest-to-northeast, it is possible that other geographically North African samples [e.g. Egyptians further south than the sampled Siwa Oasis] do not conform to this geographic cline. Finally, we also observe European ancestry that is not clearly accounted for by the inclusion of a Near Eastern sample. Additional migration coming from Europe might be plausible, though the origin and the period where it took place cannot be determined with the present data. The less than 25% European ancestry in populations like Algerians and northern Moroccans could trace back to maritime migrations throughout the Mediterranean [34]. Alternatively, the Qatari could represent a poor proxy for an Arabic source population, causing additional diversity to be assigned European [e.g. European ancestry tracts were not reliably assigned as European with PCADMIX].
In summary, although paleoanthropological evidence has established the ancient presence of anatomically modern humans in northern Africa prior to 60,000 ya [35], the simplest interpretation of our results is that the majority of ancestry in modern North Africans derives from populations outside of Africa, through at least two episodes of increased gene flow during the past 40,000 years [Figure 1, Figure 2, Figure 3].
Reconstructing Multiple Admixed Ancestries
Multiple local ancestry assignment methods, including PCADMIX, require thinning genotype datasets to remove alleles in high linkage disequilibrium between populations [29], [36]; this step discards information regarding haplotype patterns that tend to be more informative than genotypes when using data biased by SNP ascertainment [37]. HAPMIX incorporates both LD information and uncertainty in phase inference for haplotypes [18], but the software is currently limited to a two-population model. Our ancestral proportions of European and sub-Saharan ancestry for many North Africans at k = 2 [Figure 1] are similar to those obtained with HAPMIX by Price et al. [18] for the HGDP Algerian Mozabites, assuming a two-population mixture of northern Europeans and Yoruba. However, our results show that increasing the number of possible ancestral populations reveals multiple, diverse ancestries [e.g. Maghrebi, Near Eastern, Nilotic] and that the proportion of sub-Saharan African assignment decreases as these other ancestries are accounted for. This decrease in assigned sub-Saharan ancestry in North African samples, from a k = 2 model, is consistent with an interpretation that Maghrebi or Near Eastern diversity that is not present in the panel populations is more likely to be assigned to the more diverse, Sub-Saharan African ancestry. Using a two-population admixture model, Price et al. [18] estimated the time of migration from sub-Saharan Africa into the Mozabites to have begun about 100 generations ago [or more]. Our results suggest that sub-Saharan African and Maghreb admixture is considerably more recent, 2441 generations ago [and even the upper 95% CI estimate under either model is 55ga, Table 1]. The discrepancy between these two estimates may result from our incorporation of multiple source populations, our use of non-linear models to estimate migration timing and the elimination, in Price et al. [18], of individuals with megabase long African segments.
Time of Migration Estimation
We use a two-population model of migration where we measure the number and length of migrant tracts observed in the admixed population. However, as argued earlier, North African populations have absorbed migrants from multiple episodes of migration. We use three- and four-population admixture deconvolution to identify the tracts from these separate migrations. One complication with this approach is the possibility that source populations that contribute migrants to North Africa are themselves exchanging migrants. For example, Near Eastern populations expanded into European continent during the Neolithic, and even an isolated population like the Spanish Basque may have genomic segments that trace back to the Neolithic expansion [38], [39]. In this case, estimation of the time of migration of Arabic individuals into North Africa would be biased by Basque segments of Arab ancestry that were contributed by Europeans, but are locally assigned to Arabic ancestry. We confine our migration estimates to those from sub-Saharan populations into North Africans because there has likely been relatively little recent gene flow between sub-Saharan Africans and the European/Near Eastern populations. Moorjani et al. [40] present evidence for recent gene flow [<100 generations ago] from Africa to the Near East and Europe. But, they hypothesize it might be due to North African migrations, rather than sub-Saharan Africa.
Migration Implications
Assuming a 30-year generation time [41], the proposed migration of sub-Saharans to southern Morocco at about 1,200 years ago coincides with the rise of the Ghana Empire, involved in the trans-Saharan slave trading, and the Great Berber Uprising which established Berber kingdoms throughout Morocco. We use a Bantu-speaking population from Kenya as a source population for this migration, as North African individuals with sub-Saharan ancestry appeared to be closer to the Luhya than the Nigerian Yoruba [Figure 1, Figure 2 and Figure S2]. However, there are likely other western African populations genetically similar to Kenyan Bantu-speakers. We do not interpret this association as an explicit migration from Kenya to southern Morocco. We also use the length of Nilotic tracts in Egyptians to ask if sub-Saharan ancestry [apparent in Figure 1 and Figure 6] also appears to be a recent introduction. Under a pulse model of migration, a significant increase in gene flow likely occurred ~700 ya, after the Arabic expansion into North Africa 1,400 ya. Our migration results are in agreement with previous studies based on mtDNA analysis where gene flow into eastern and western North Africa appeared to have different sub-Saharan population sources [10], [16].
Conclusion
Our genome-wide dense genotyping data from seven North African populations allow us to address outstanding questions regarding the origin and migration history of North Africa. We propose that present-day ancestry in North Africa is the result of at least three distinct episodes: ancient back-to-Africa gene flow prior to the Holocene, more recent gene flow from the Near East resulting in a longitudinal gradient, and limited but very recent migrations from sub-Saharan Africa. Population structure in North Africa is particularly complex, and future disease or phenotypic studies should carefully account for local demographic history. However, the rich history of gene flow can also help empower genome-wide association mapping via admixture mapping techniques [42]. For example, the variable but relatively long haplotypes of sub-Saharan ancestry are amenable to admixture mapping approaches developed for African-American samples. In conclusion, North African populations retain a unique signature of early Maghrebi ancestry, but North African populations are not a homogenous group and most display varying combinations of five distinct ancestries.
Posts: 42918 | From: , | Registered: Jan 2010
| IP: Logged |
posted
Materials and Methods Samples and Data Generation A total of 152 individuals representing seven different North African locations and the Basque Country were included in the present study. Informed consent was obtained from all of them. Samples were genotyped on the Affymetrix 6.0 chip, and after quality control filtering for missing loci and close relatives, 125 individuals remained: 18 from North Morocco, 16 from South Morocco, 18 from Western Sahara, 19 from Algeria, 18 from Tunisia, 17 from Libya and 19 from Egypt. Further information on the samples may be found in Table S1. Moreover, 20 individuals from the Spanish Basque country were included in the analysis. Data are publicly available at: bhusers.upf.edu/dcomas/. In order to study the population structure and the genetic influence of migrants in the region a database was built including African and European populations from HapMap3 [43], western Africa [20], and 20 Qatari from the Arabian Peninsula [44] as Near Eastern representatives. Written informed consent was obtained from the participants and analyses were performed anonymously. The project obtained the ethics approval from the Institutional Review Board of the institution involved in the sampling [Comitè Ètic d'Investigació Clínica - Institut Municipal d'Assistència Sanitària [CEIC-IMAS] in Barcelona, Spain]. Population Structure An unsupervised clustering algorithm, ADMIXTURE [25], was run on our seven new North African populations, Spanish Basque, Near Eastern Qatari, western Africans, HapMap3 Kenyan Luhya, Maasai and Italian Tuscans. Nine ancestral clusters [k = 2 through 10] in total were tested successively. Log likelihoods for each k clusters are available in Figure S1B. Fst based on allele frequencies was calculated in ADMIXTURE for each identified cluster at k = 8. Given the high heterogeneity in Qatari population, we present individuals with the lowest sub-Saharan, European and North African ancestries and higher Near Eastern ancestry, based on ADMIXTURE. Multidimensional scaling [MDS] was applied to the pairwise IBS Matrix of 279,528 SNPs using PLINK 1.07 software [45]. The top three MDS components were plotted together using R 2.11.1. Population divergence estimates from the cluster-based allele frequencies from ADMIXTURE [k = 58] were obtained using [46]:
The cluster-based allele frequencies will be less biased by recent migration between populations. Estimates of population divergence, though potentially older if migration is unaccounted for in the Fst estimate, are unlikely to be younger if the range of Ne sizes is realistic. Phasing In previous work, imputation accuracy was tested in a sample of Algerian Mozabites and other populations from the Human Genome Diversity Project [HGDP-CEPH] [37]. Among all the African populations, the Mozabites had the poorest imputation accuracy when the sub-Saharan Yoruban sample was used to predict allele states [37]. For this reason, we used multiple populations for phase inference. North African, Qatari and Basque genotypes were phased using BEAGLE 3.0 software [47]. Phased haplotypes from three HapMap3 populations [i.e. Maasai, Yoruba, and Tuscans] were used as seeds for haploype inference; each HapMap3 population was randomly sub-sampled for 30 individuals each in order to prevent over-representation of haplotypes from a single geographic region. The Basque, Qatari and all North African populations were phased with the same three seed populations to prevent discrepancies based solely on different haplotype seeds. Inference of IBD We estimate the amount of DNA shared identically by descent [IBD] using the GERMLINE software [27], with a 5 cM threshold to eliminate false positive IBD matches. All 5 cM or greater segments shared IBD between pairs of individuals were summed, and histograms created for sharing within each North African population. PCABased Local Ancestry Assignment Local ancestry was assigned with a new PCA-based method, PCADMIX. This method uses phased genotype data [i.e., haplotypes] to determine exact posterior probabilities along each chromosome. PCADMIX relies on Principal Components Analysis [PCA] to quantify the information that each SNP contributes to distinguishing the ancestry of a genomic region. PCADMIX is publicly available at sites.google.com/site/PCADMIX. We use Singular Value Decomposition in R to perform PCA on the phased genotypes of the ancestral representatives. We project admixed individuals on the basis of principal components, and compute the observed ancestry score for a haplotype i in the jth window as the weighted average Ljgij, where gij is a column vector of the haplotype's alleles [coded as 0 or 1] in window j, standardized by the mean and standard deviation of that SNP's frequency in the ancestral populations. Lj is a matrix for which the entry in the kth row, lth column is the loading of SNP l in the window on principal component k. We use a forward-backward algorithm to identify the probability of ancestry at each window, conditional on the ancestry scores. For the forward-backward algorithm in our HMM, we used a haploid version of the transition and emission probabilities in the Viterbi algorithm of Bryc et al. [20]. The transition probability is defined by p, the probability of recombination between windows, and qj, the frequency of the target population's chromosomes in the admixing ancestral pool. First, ancestral populations are thinned for SNPs with r2<0.8 in order to remove highly linked alleles from different populations, which can lead to spurious ancestry transitions. Second, chromosomes for each individual in a population are artificially strung together to create two haploid genomes for the individual; this step increases the amount of information used for PCA, and it is of special relevance given that Europeans, Near Easterners and North African are differentiated with an Fst of only ~0.05. Then, PCA on a number k≤3 of ancestral populations is performed and the admixed population is projected into the determined k≤3 PCA space. PC loadings are used as weights in a weighted average of the allele values in a window of 40 SNPs. These window scores are then used as observed values in a HMM to assign posterior probabilities to the ancestry in each window [where chromosome were considered separately]. Information on using PCADMIX in Egyptians is available in Figure S8. Additional performance testing and details of the implementation for this approach are available in [28], Texts S1, S2, S3 and Figure S9. Estimates of Migration Parameters We tabulated the length and number of genomic tracts [i.e. phased haplotypes] assigned to particular population ancestries for the South Moroccan and Egyptian population samples [see above for PCA-based local ancestry assignment]. We used a posterior probability threshold of 0.8, optimized for concordance with ADMIXTURE ancestry proportions [Figure 5A]. The maximum likelihood estimate of the time of migration is sensitive to the minimum detectable length of migrant tracts. That is, as migrant tracts recombine with non-migrants and become smaller in size, we are less likely to detect them. Histograms of the cumulative number of migrant tracts of different lengths, for all individuals, were visualized [Figure S10] and we observe a reduction in the number of short migrant tracts in the 0.5 to 1.5 cM bins, inconsistent with constant or punctual migration model. Rather, this reduction can be understood as a reduction in our ability to detect short migrant segments due to insufficient SNP density or haplotype variation that is not present in our source population. We therefore choose a 3 cM threshold as the minimal length of migrant tracts to be considered. Theoretically, under an isolation followed by migration model and with a 3 cM tract length threshold, we have power to detect relatively recent migrations occurring within the past generations [30]. We modify Pool and Nielsen [30] equation 10, with for the likelihood that a segment is of length Morgans given that it is longer than the cutoff length in a model with constant migration rate starting at time in a chromosome of length . Similarly, we estimated a likelihood of for punctuated migration occurring generations ago, which neglects chromosomal edge effects, an approximation justified by the fact that for a large majority of tracts. Supporting Information Figure S1. A] ADMIXTURE results for k = 10 ancestral clusters in our North African populations, Spanish Basque, Near Eastern Qatari, western Africans, HapMap3 Kenyan Luhya and Maasai and Italian Tuscans. B] Log likelihoods for each of the k clusters tested. [TIF] Figure S2. We used multidimensional scaling [MDS] to discriminate clusters of genetic variation within Africa and neighboring regions. MDS was applied to the pairwise, individual identity-by-state [IBS] matrix of 279,500 SNPs using PLINK 1.07 software [45]. The component 3 versus 4 [A] and component 1 versus component 2 versus component 3 [B] were plotted together using R 2.11.1. Population colors match Figure S1A [k = 10]. North African populations are all indicated in turquoise. [TIF] Figure S3. Long runs of homozygosity compared across North African populations and neighbors. homozyg homozyg-window-kb 5000 homozyg-window-het 1 homozyg-window-missing 1 homozyg-snp 25 homozyg-kb 500 homozyg-gap 100. [TIF] Figure S4. Implementation of PCADMIX. A] A principal components analysis is first run for k = 3 ancestral populations. The proportion of Population A's ancestry in an admixed individual is estimated by: a given haplotype's [black square] distance from the line connecting the means of PCA1 and PC2 for the two other populations, as a proportion of the haplotype's distance from all edges. B] Simulated ancestry assignment with and without LD filtering. The black arrow indicates a region of simulated European ancestry that is incorrectly classified [at a posterior probability calling threshold of 0.9] as African when no linkage disequilbrium [LD] filtering is used, and whose ancestry is left undecided when LD filtering is implemented [r2<0.8]. [TIF] Figure S5. Comparison of ADMIXTURE and PCADMIX ancestry estimations in [A] South Moroccans and [B] Egyptians. In both cases PCADMIX was required to assign ancestry with a posterior probability of 0.95. The 0.95 threshold substantially reduces the proportion of the genome assigned by PCADMIX. In South Moroccans, the reduction in assigned ancestry occurs primarily in the European and to a lesser extent in the Berber component. For the Egyptians, the reduction in assigned ancestry is dramatically reduce Near Eastern [or Arabic] ancestry. [TIF] Figure S6. A] PCADMIX applied to a South Moroccan individual using Saharawi, Basques and Luhyan as ancestral populations. Segments are assigned to ancestries with a posterior probability higher than 0.8. B] PCADMIX applied to the same South Moroccan individual as in A] using Tunisian, Basque and Luhya as the ancestral populations. Segments are assigned to ancestries with a posterior probability higher than 0.8. [TIF] Figure S7. We capture admixture proportions by independently running LAMP [29] for estimating local ancestry using the Tunisian Berber, European Basque and sub-Saharan Luhya source populations. Sub-Saharan ancestry appears concordant with ADMIXTURE and PCADMIX. Tracts of Maghrebi ancestry appear shorter than those inferred in PCADMIX, although this may be attributed to the use of the high Maghrebi but low diversity Tunisian Berbers. Results are shown for chromosome 1 [A] and X chromosome [B]. [TIF] Figure S8. Shown is the admixture deconvolution for chromosome 1 using PCADMIX for 19 Egyptian individuals [n = 38]. Initially we assigned ancestry for k = 3 ancestral populations [Maghreb: SAH, European: BAS, Sub-Saharan: MKK] using a 0.8 posterior probability threshold, shown in [A,B]. Then we assumed a different set of 3 ancestral populations [Maghreb: SAH, European: BAS, Near Eastern: QAT] shown in [C,D]. In the third step, we assumed the Sub-Saharan ancestry, assigned in A, represented truly divergent sub-Saharan haplotypes given the high Fst between this ancestry and all others. E] We layered these haplotypes on top of [C] [Maghreb, European, Near Eastern] deconvoluted chromosomes. [TIF] Figure S9. A] We present the average assigned ancestry [>0.8 posterior probability] across chromosome 1 for each of 4 ancestries assigned in the Egyptians: Maghrebi [Saharawi], European [Basque], Near Eastern [Qatari], Sub-Saharan [Maasai]. [TIF] Figure S10. A] Distribution of the number and length in centimorgans of migrant Sub-Saharan [Luhya] tracts distributed by length found in the South Moroccan population. B] Distribution of the number and length in centimorgans of migrant Sub-Saharan [Maasai] tracts distributed by length found in the Egyptian population. Red bar indicates the minimum threshold cutoff employed in the migration parameter analysis. Please note the different scales along the X-axis. [TIF] Table S1. Name, sample size and country of origin for populations newly genotyped in the present study as well as for populations published previously. References are included in the table. [DOC] Table S2. Additional estimates of Fst after removed putative admixture events. [DOC] Table S3. Significance of the comparisons of ancestry assignment using PCADMIX and ADMIXTURE. [DOC] Text S1. Assigning local ancestry with PCADMIX. [DOC] Text S2. Concordance between ADMIXTURE and PCADMIX. [DOC] Text S3. Chromosome 1 Ancestry Deviations. [DOC]
-------------------- Note: I am not an "Egyptologist" as claimed by some still bitter, defeated, trolls creating fake profiles and posts elsewhere. Hapless losers, you still fail. My output of hard data debunking racist nonsense has actually INCREASED since you began.. Posts: 5905 | From: The Hammer | Registered: Aug 2008
| IP: Logged |
They just wont give up. Dont these people have any pride and decency. With their selective sampling and BS.
AGAIN!!
Even the whore Hawass now reluctantly admits QUOTE:
"Genetic kinship analyses revealed identical haplotypes in both mummies (table 1⇓); using the Whit Atheys haplogroup predictor, we determined the Y chromosomal haplogroup E1b1a. The testing of polymorphic autosomal microsatellite loci provided similar results in at least one allele of each marker (table 2⇓)."
--Hawass et al 2012. Revisiting the harem conspiracy and death of Ramesses III. British Medical Journal, BMJ2012;345:e8268
quote: summary:
"Genetic kinship analyses revealed identical haplotypes in both mummies (table 1⇓); using the Whit Atheys haplogroup predictor, we determined the Y chromosomal haplogroup E1b1a. The testing of polymorphic autosomal microsatellite loci provided similar results in at least one allele of each marker (table 2⇓)."
--Hawass et al 2012. Revisiting the harem conspiracy and death of Ramesses III. British Medical Journal, BMJ2012;345:e8268
Haplogroup E1b1a (now known as E-M2) is an African DNA group, most commonly found in sub-Saharan Africa QUOTE:
"Haplogroup E1b1 now contains two basal branches, E-V38 (E1b1a) and E-M215 (E1b1b), with V38/V100 joining the two previously separated lineages E-M2 (former E1b1a) and E-M329 (former E1b1c). Each of these two lineages has a peculiar geographic distribution. E-M2 is the most common haplogroup in sub-Saharan Africa, with frequency peaks in western (about 80%) and central Africa (about 60%)."
--Trombetta et al 2011. A New Topology of the Human Y Chromosome Haplogroup E1b1 (E-P2) PLoS ONE 6(1): e16073.
And
quote:Originally posted by xyyman:
quote:Originally posted by xyyman: That is one of the reasons why I decided to ignore the village idiot. After that brief discussion on People of Lerna it is clear he doesnt know what he is talking about. To suggest that Cro-magnon man morphed into Caucasoids then these Caucasoids entered Africa through Iberia, populated North Africa and East Africa, then formed ancient North/East African civilizations then re-entered Europe creating Crete(Greece) and Estrucia(Rome) is not only laughable but downright twisted. Delusional.
The Language, Culture, Morphology and Archeology tells the opposite. Now modern genetics has aligned with the said Language, Culture etc.
This table tells the story.
V-88 (Rib1b1c) is not only African, it is much older than R1b1b2a(European lineage). So when you read these studies about R1b lineage the first question you have to ask yourself as an intelligent reader is what is the resolution and what branch of R1b tree is the test subject? Because it is only through high resolution one can tell the African R1b and the European R1b. Euronuts purposely cite R1b, the tree, to confuse the reader into thinking it is European. They purposely refuse to cite the branch. It is all trickery and lies. Some of us are now catching and exposing them.
When they are cornered they then try to wiggle their way out of it and talk about Eurasian back migration yet there is no evidence of such ancient migration activity. Why??? The North African have a higher frequency of African R1b(V-88) than European R1b(R1b1b2a2). Using THEIR hypothesis of age combined with frequency, It looks like there was an ancient population of R1b*that existed in maybe the Sahel region (Cameroon/Mali). These people migrated out from there. Some lineage died out. Even the modern Egyptians carry more R1b (African) than R1b (European). See table. I am not making this shyte up!!
So, no, Cro-Magnon did not enter North Africa. Try it the other way around; the older lineage entered Southern Europe from North Africa. This is why eye ball anthropology is unreasonable and bizarre, and should be ignored. Eye-ball anthropology is for those with limited reading comprehension. Some North African groups did not get their features due to admixture from Europeans but most likely the other way around. Europeans are decedents of North Africans and maybe East Africans. WAIT!!! LOL! That was published already(Sergi, Smith, Angel, Evans etc)!!!
That is why genetics is now changing the way we view evolution and migration of humans out of Africa.
No! Caucasoids did not enter Africa, but the other way around, Caucasoids entered Europe from Africa!!!!!!!!!
Posts: 12143 | From: When you have eliminated the impossible, whatever remains, however improbable | Registered: Jun 2007
| IP: Logged |
-------------------- Without data you are just another person with an opinion - Deming Posts: 12143 | From: When you have eliminated the impossible, whatever remains, however improbable | Registered: Jun 2007
| IP: Logged |
posted
BTW - you do know why their last resort is autosomal studies?
Quote from the study: "we present analysis of autosomal single nucleotide polymorphism [SNP]".
Selective population sampling and selective gene testing. LOL!! Give me a break!
The Berbers type people are indigenous Africans going back maybe 35,000ya. They did not migrate from anywhere because they never really left the continent except to form Crete and Iberian civilization, etc about 5000ya.
Posts: 12143 | From: When you have eliminated the impossible, whatever remains, however improbable | Registered: Jun 2007
| IP: Logged |
The above-mentioned studies have thus revealed a dual influence in the genetic make-up of this African people. In this study, we provide new mtDNA and Y chromosome data sets of three unrelated Tuareg groups from three different countries (Niger, Mali and Burkina Faso). At the same time, we try to unravel the questions of their genetic origin, the mutual relationships among their sub-populations as well as possible links to neighbouring populations. The genetic heritage of the Tuareg population is analysed within the context of the West Eurasian versus sub-Saharan contributions to their gene pool. A total of 48% of the mtDNA haplotypes observed in the Tuareg populations could be ascribed to sub-Saharan haplogroups. Another 39%, however, were of West Eurasian ancestry (non-L types in Table 1), which is a substantial proportion considering the sub-Saharan geographical location. In fact, it has been observed that in typical North African populations there is a gradient of increasing frequency of West Eurasian lineages ranging from around 5075% in the northernmost locations.34 The Tuareg's neighbours, however, have a markedly smaller proportion of West Eurasian haplotypes (22% in Western Chad Arabs, 8% in Shuwa Arabs from North-eastern Nigeria, 7% in the Buduma from South-eastern Niger and 6% in the Kanuri from North-eastern Nigeria).35 The remaining 13% of Tuareg haplotypes belong to the typical East African haplogroup M1.
Furthermore, we noticed some differences in the distribution of West Eurasian mtDNA haplogroups between Tuareg groups. Most of the West Eurasian haplogroups (30 out of 35 sequences, amounting to 6 out of 9 HVS-I haplotypes) and the East African M1 (11 out of 12 sequences but amounting to only 2 out of 3 HVS-I haplotypes) are observed in the two Tuareg populations TGos and TGor located within the bend of the Niger. Tuareg from the Republic of Niger, TTan, have much higher proportion of sub-Saharan (81%) haplogroups than of West Eurasian (16%) and East African (3%) ones. These differences in haplogroup distribution led to statistically significant genetic distances when comparing HVS-I haplotypes between Tuareg from Mali (TGos) with those from the Republic of Niger (TTan) (FST=0.048; unadjusted P-value=0.009), as well as Tuareg from Burkina Faso (TGor) with those from the Republic of Niger (TTan) (FST=0.064; unadjusted P-value=0.000), whereas Tuareg from Mali (TGos) and from Burkina Faso (TGor) are not statistically different (FST=0.012; unadjusted P-value=0.234). Similarly, analysis of MDS based on FST distances and using a large database of West Eurasian and African mtDNA sequences has shown a very good separation of the sub-Saharan and West Eurasian-North African gene pools (Figure 2). Only some East African populations are closer to the West Eurasian samples, respectively, to the North African populations analysed here. This picture is a good representation of FST values as the normalized raw stress is very low (0.01165). However, the analysed Tuareg populations are divided between two gene pools: like the sample from Libya,5 the groups located within the bend of Niger (TGor and TGos) fall into the West Eurasian gene pool, whereas the Tuareg from the Republic of Niger (TTan) and the Tuareg sample from the Watson's data set3, 4 are permeated by the sub-Saharan mtDNA gene pool. The West Eurasian component observed in the Tuareg is highly interesting. A major proportion (94%) could be allocated to haplogroups H1, H3 and V, West Eurasian lineages of Iberian origin that spread to Europe7, 10, 17, 26, 29, 36 and most probably North Africa30, 31 with the improvement of the climatic conditions after the retreat of the ice sheets 1500013000 years ago. The interpolation maps of these lineages across North Africa and Europe (Supplementary Material SM5) clearly place the Tuareg population in the path of the southern African edge of post-Last Glacial Maximum expansions. The H1 haplogroup (Supplementary Material SM5A and SM5B, with and without the outlier Norway, respectively) is as frequent in our southern Tuareg groups as in Libya and the centre of the dispersion within the Iberian Peninsula. The H3 haplogroup is almost vestigial in Tuareg (Supplementary Material SM5C), having the highest observed frequencies outside of Iberia in Algeria and Tunisia. Again for haplogroup V, Tuareg present frequencies as high as in the Basque country (Supplementary Material SM5D)
Posts: 42918 | From: , | Registered: Jan 2010
| IP: Logged |
Our genome-wide dense genotyping data from seven North African populations allow us to address outstanding questions regarding the origin and migration history of North Africa. We propose that present-day ancestry in North Africa is the result of at least three distinct episodes: ancient back-to-Africa gene flow
It's interesting to have an genetic study confirming what we already knew. The original inhabitant of North Africa were black Africans we can see in the early Tassili rock painting. They were followed by back to Africa migration from people from the Levant/West Asia a long time ago. This movement back to Africa (obviously) postdate the out of Africa migration.
Posts: 2981 | Registered: Jan 2012
| IP: Logged |
The above-mentioned studies have thus revealed a dual influence in the genetic make-up of this African people. In this study, we provide new mtDNA and Y chromosome data sets of three unrelated Tuareg groups from three different countries (Niger, Mali and Burkina Faso). At the same time, we try to unravel the questions of their genetic origin, the mutual relationships among their sub-populations as well as possible links to neighbouring populations. The genetic heritage of the Tuareg population is analysed within the context of the West Eurasian versus sub-Saharan contributions to their gene pool. A total of 48% of the mtDNA haplotypes observed in the Tuareg populations could be ascribed to sub-Saharan haplogroups. Another 39%, however, were of West Eurasian ancestry (non-L types in Table 1), which is a substantial proportion considering the sub-Saharan geographical location. In fact, it has been observed that in typical North African populations there is a gradient of increasing frequency of West Eurasian lineages ranging from around 5075% in the northernmost locations.34 The Tuareg's neighbours, however, have a markedly smaller proportion of West Eurasian haplotypes (22% in Western Chad Arabs, 8% in Shuwa Arabs from North-eastern Nigeria, 7% in the Buduma from South-eastern Niger and 6% in the Kanuri from North-eastern Nigeria).35 The remaining 13% of Tuareg haplotypes belong to the typical East African haplogroup M1.
Furthermore, we noticed some differences in the distribution of West Eurasian mtDNA haplogroups between Tuareg groups. Most of the West Eurasian haplogroups (30 out of 35 sequences, amounting to 6 out of 9 HVS-I haplotypes) and the East African M1 (11 out of 12 sequences but amounting to only 2 out of 3 HVS-I haplotypes) are observed in the two Tuareg populations TGos and TGor located within the bend of the Niger. Tuareg from the Republic of Niger, TTan, have much higher proportion of sub-Saharan (81%) haplogroups than of West Eurasian (16%) and East African (3%) ones. These differences in haplogroup distribution led to statistically significant genetic distances when comparing HVS-I haplotypes between Tuareg from Mali (TGos) with those from the Republic of Niger (TTan) (FST=0.048; unadjusted P-value=0.009), as well as Tuareg from Burkina Faso (TGor) with those from the Republic of Niger (TTan) (FST=0.064; unadjusted P-value=0.000), whereas Tuareg from Mali (TGos) and from Burkina Faso (TGor) are not statistically different (FST=0.012; unadjusted P-value=0.234). Similarly, analysis of MDS based on FST distances and using a large database of West Eurasian and African mtDNA sequences has shown a very good separation of the sub-Saharan and West Eurasian-North African gene pools (Figure 2). Only some East African populations are closer to the West Eurasian samples, respectively, to the North African populations analysed here. This picture is a good representation of FST values as the normalized raw stress is very low (0.01165). However, the analysed Tuareg populations are divided between two gene pools: like the sample from Libya,5 the groups located within the bend of Niger (TGor and TGos) fall into the West Eurasian gene pool, whereas the Tuareg from the Republic of Niger (TTan) and the Tuareg sample from the Watson's data set3, 4 are permeated by the sub-Saharan mtDNA gene pool. The West Eurasian component observed in the Tuareg is highly interesting. A major proportion (94%) could be allocated to haplogroups H1, H3 and V, West Eurasian lineages of Iberian origin that spread to Europe7, 10, 17, 26, 29, 36 and most probably North Africa30, 31 with the improvement of the climatic conditions after the retreat of the ice sheets 1500013000 years ago. The interpolation maps of these lineages across North Africa and Europe (Supplementary Material SM5) clearly place the Tuareg population in the path of the southern African edge of post-Last Glacial Maximum expansions. The H1 haplogroup (Supplementary Material SM5A and SM5B, with and without the outlier Norway, respectively) is as frequent in our southern Tuareg groups as in Libya and the centre of the dispersion within the Iberian Peninsula. The H3 haplogroup is almost vestigial in Tuareg (Supplementary Material SM5C), having the highest observed frequencies outside of Iberia in Algeria and Tunisia. Again for haplogroup V, Tuareg present frequencies as high as in the Basque country (Supplementary Material SM5D)
Again, it speaks of the Fezzan isolation, based on founder effect.
The Tuareg stem from the Beja.
In overall Hg Tuareg are genetically African in y-DNA and mt-DNA.
Perhaps you have info on the basal clade Hg H and it's frequencies. And a summation of the alleles.
Newcomer in early eurafrican population ?
quote:A complete mandible of Homo erectus was discovered at the Thomas I quarry in Casablanca by a French-Moroccan team co-led by Jean-Paul Raynal, CNRS senior researcher at the PACEA(1) aboratory (CNRS/Université Bordeaux 1/ Ministry of Culture and Communication). This mandible is the oldest human fossil uncovered from scientific excavations in Morocco. The discovery will help better define northern Africa's possible role in first populating southern Europe.
A Homo erectus half-jaw had already been found at the Thomas I quarry in 1969, but it was a chance discovery and therefore with no archeological context.
This is not the case for the fossil discovered May 15, 2008, whose characteristics are very similar to those of the half-jaw found in 1969. The morphology of these remains is different from the three mandibles found at the Tighenif site in Algeria that were used, in 1963, to define the North African variety of Homo erectus, known as Homo mauritanicus, dated to 700,000 B.C.
The mandible from the Thomas I quarry was found in a layer below one where the team has previously found four human teeth (three premolars and one incisor) from Homo erectus, one of which was dated to 500,000 B.C. The human remains were grouped with carved stone tools characteristic of the Acheulian(2) civilization and numerous animal remains (baboons, gazelles, equines, bears, rhinoceroses, and elephants), as well as large numbers of small mammals, which point to a slightly older time frame. Several dating methods are being used to refine the chronology.
The Thomas I quarry in Casablanca confirms its role as one of the most important prehistoric sites for understanding the early population of northwest Africa. The excavations that CNRS and the Institut National des Sciences de lArchéologie et du Patrimoine du Maroc have led there since 1988 are part of a French-Moroccan collaboration. They have been jointly financed by the French Ministry of Foreign Affairs(3), the Department of Human Evolution at the Max Plank Institute in Leipzig (Germany), INSAP(4)(Morocco) and the Aquitaine region.
Photo 1 Photograph of the fossil human mandible discovered May 15, 2008 at the Thomas I quarry site in Casablanca.
Photo 2 Jean-Paul Raynal and Professor Fatima-Zohra Sbihi-Alaoui from the Institut National des Sciences de l'Archéologie et du Patrimoine (INSAP-Rabat) free the fossil mandible..fr)
Notes: 1) De la Préhistoire à l'Actuel : Culture, Environnement et Anthropologie (From Prehistory to Present day: Culture, Environment, and Anthropology) 2) Acheulians appeared in Africa around 1.5 million years ago and disappeared about 300,000 years ago, giving way to Middle Stone Age civilizations. Their material culture is characterized by the production of large stone fragments shaped into bifacial pieces and hatchets, and of large sharp-edged objects. 3) (Mission archéologique « littoral » Maroc, led by J.P. Raynal). 4) (INSAP-Rabat) which falls under the authority of the Moroccan Ministry of Cultural Affairs.
Dental Evidence from the Aterian Human Populations of Morocco
posted
we already covered Libyan Tuaregs look at the main Genomic Ancestry article at the top of the thread
Posts: 42918 | From: , | Registered: Jan 2010
| IP: Logged |
quote:Originally posted by the lioness,: we already covered Libyan Tuaregs look at the main Genomic Ancestry article at the top of the thread
Who is "we". And it wasn't covered already. All you do it post the same articles over and over again. You have posted this same thing at least 5 times. With lacking sufficient interpretation.
So perhaps you have info on the basal clade Hg H and it's frequencies. And a summation of the alleles.
And will you're at it, you may like to explain why the first settlers at the Iberia came from Africa. Northwest Africa. Part of the larger group, the Nubian Complex. Instead of what your citation supports, Eurasia? Which makes no sense by the way.
Not too long ago you made a thread on North Africa's history, wherein you got slapped all over the places. Remember? Or are you truly this senile?
By the way, the Tuareg and Fulani show kinship via E-V68.
Posts: 22234 | From: האם אינכם כילדי הכרית אלי בני ישראל | Registered: Nov 2010
| IP: Logged |
quote:Originally posted by the lioness,: [qb] we already covered Libyan Tuaregs look at the main Genomic Ancestry article at the top of the thread
Who is "we". And it wasn't covered already. All you do it post the same articles over and over again. You have posted this same thing at least 5 times. With lacking sufficient interpretation.
Each time it was posted people including you had the opprtunity comment and did. That's why it has been covered already. I posted Libyan Tuareg again it for xxxyman because he wasn't in those threads commenting on it A lot of the details in this Genomic Ancestry article have not been discussed as much and I posted a lot more of it.
Posts: 42918 | From: , | Registered: Jan 2010
| IP: Logged |
posted
Since you don't get it, let me break it down for you.
Identification/Population Affinity can be determined by several genetic methods.
(Keep in mind in the old days there were other methods which are still valid. Cranoimetrically, dentition, limb proportion etc)
Genetically, there are three primary methods. 1. Lineage ie Y-DNA, Mt-DNA 2. STR Tells what geographic region of the world the individual is from. 3. SNP still being formalized. But criss-crosses geographic boundaries.
1. Lineage is still the most reliable. Why? Most people still live where their ancestors have lived for thousands of years. And those who migrated, eg the Americas, we know where they came from. I carry my fathers sperm type, and my sons and their sons will carry the same. The sperms dont lie. LOL!! There are only about 20 y-DNA Macro-haplogroups. Hg-E and a few others are undoubtedly African. Similarly for Mt-DNA hg-L*, U6, M1 and N, X, I etc, And maybe HV. 2. STR There are approximately 9-18 STRs located on different chromosomes that are currently used to id a persons geographic origin. These are well established methods used by forensic scientist. Using published STRs alleles we now know the Amarnas mummies AND Rameses III from sub-sahara Africa. Afro-centics are batting 100. He! He! He!. we told you so!. 3. SNPs is in its infancy. Why? Because it is easily manipulated. First-off they are approximately 13, 000, 000, yes, 13million, SNPs in the human genome. I can have my Afro-centric research brothas chose 1000 SNP and have them conclude that NAian Berbers are genetically closer to Sub-Saharan. And conversely, the racialist can chose another 1000 out of the 13,000, 000 SNP(ie 0.007%!!!) and conclude that NAian Brbers are closer to Eurasians. Point being SNPS are not reliable. While lineage, Lineage, STRs, limb proportion are far more reliable.
So!!! In keeping with the Eurocentric naming convention. Looking at the evidence, I have to conclude the AEians were Sub-Saharan Caucasoids.. Ha! Ha! Ha! Truth is indeed stranger than fiction.
But, shyte the AEians said they came from the South.
-------------------- Without data you are just another person with an opinion - Deming Posts: 12143 | From: When you have eliminated the impossible, whatever remains, however improbable | Registered: Jun 2007
| IP: Logged |
posted
Lioness, you are no match for me. I never came across a Eurocentric who can out-think me given the same tools. In the words of Lumumba Let us show the world what the black man can do when he works in freedom . . . .again!!
Does matter how large your vrew is ----Lioness Productions or Mission Diego
Posts: 12143 | From: When you have eliminated the impossible, whatever remains, however improbable | Registered: Jun 2007
| IP: Logged |
posted
Stop ego tripping you ain't all that. Even Djehutie fvcked you up I am not Eurocentric I just think North Africa has been somewhat mixed with Levantine/Med popualtions or intermediate with those populations for a few to several thousands of years. I don't think that equals Eurocentric. There aren't current mainstream books written by white people that say the Egyptians were white or Caucasoid. So to that extent the battle is won
quote:Originally posted by xyyman: [QB] Since you don't get it, let me break it down for you.
Identification/Population Affinity can be determined by several genetic methods.
(Keep in mind in the old days there were other methods which are still valid. Cranoimetrically, dentition, limb proportion etc)
Genetically, there are three primary methods. 1. Lineage ie Y-DNA, Mt-DNA 2. STR Tells what geographic region of the world the individual is from. 3. SNP still being formalized. But criss-crosses geographic boundaries.
1. Lineage is still the most reliable. Why? Most people still live where their ancestors have lived for thousands of years.
Many Copts are a shade of brown and looked mixed. What do you think of DNA Consultants recent report that Copts had a relatively high affinty to AEs? That fits right along with your comment above on lineage
Posts: 42918 | From: , | Registered: Jan 2010
| IP: Logged |
posted
Tsk! Tsk Tsk! Are you listening to yourself?
Quote: "Many Copts are a shade of BROWN and LOOKED mixed". Ha! Ha!
Still don't get how nature/evolution works? I assumed your crew had a higher level of education maybe I am mistaken.
I will make it simply. How a person LOOK could be a result of (1) admixture or (2) they evolved to look that way. That is their natural look.
So please..... no eye-balling anthropology.
For a start, take the UV map of the earth, overlay that over the indigenous skin color of peoples of the world created in the 1950's.
Note: It is a perfect match. Conclusion?
Notice unlike some Afro-centric - I maintain the light skin(not white) IS indigenous to Africa. So to are the so called Caucasoid features. That is why I have no problem with the word,Caucasoids, now. Hell..look at the AEians, Black Caucasoids from Sub-sahara Africa.
Life is a bitch. He! He!
Posts: 12143 | From: When you have eliminated the impossible, whatever remains, however improbable | Registered: Jun 2007
| IP: Logged |
posted
^ you aren't the only one who has this philosophy on light skinned development within Africa. I have posted several documents and papers on this. And Zarahan did so too. Lioness know this.
quote:Originally posted by the lioness,:
quote:Originally posted by Troll Patrol:
quote:Originally posted by the lioness,: [qb] we already covered Libyan Tuaregs look at the main Genomic Ancestry article at the top of the thread
Who is "we". And it wasn't covered already. All you do it post the same articles over and over again. You have posted this same thing at least 5 times. With lacking sufficient interpretation.
Each time it was posted people including you had the opprtunity comment and did. That's why it has been covered already. I posted Libyan Tuareg again it for xxxyman because he wasn't in those threads commenting on it A lot of the details in this Genomic Ancestry article have not been discussed as much and I posted a lot more of it.
Lioness, show info on the basal clade Hg H and it's frequencies. And a summation of the alleles.
It's you who posted those studies after all on Hg HV, H and V.
We have to get to the bottom of this. Like we have done with Hg M, M1 and U6.
Posts: 22234 | From: האם אינכם כילדי הכרית אלי בני ישראל | Registered: Nov 2010
| IP: Logged |
posted
Interesting paper....this is the only scenaro that makes geographic sense. I always contend that the forest belt was primarily inhabited by Biaka type peoples. Newer Africans eg E1b1a are recent arrivals from the North. Wasn't it Gatto et al who showed the so-called Bantu type occupied the Green Sahara along with the Berber type.
Quote: "However, the extant geographical conditions present a biased picture of the situation before and during the last out-of-Africa movement. Much emphasis has been placed on Sub-Saharan populations, who live in areas that are often regarded to be where non-African modern humans originated. In fact, some of the extant sub-Saharan populations might be displaced populations whose hunter-gatherer ancestors lived further north."
quote:Originally posted by Troll Patrol: [QUOTE]ry of Cultural Affairs.
Dental Evidence from the Aterian Human Populations of Morocco
quote:Originally posted by xyyman: Interesting paper....this is the only scenaro that makes geographic sense. I always contend that the forest belt was primarily inhabited by Biaka type peoples. Newer Africans eg E1b1a are recent arrivals from the North. Wasn't it Gatto et al who showed the so-called Bantu type occupied the Green Sahara along with the Berber type.
Quote: "However, the extant geographical conditions present a biased picture of the situation before and during the last out-of-Africa movement. Much emphasis has been placed on Sub-Saharan populations, who live in areas that are often regarded to be where non-African modern humans originated. In fact, some of the extant sub-Saharan populations might be displaced populations whose hunter-gatherer ancestors lived further north."
quote:Originally posted by Troll Patrol: [QUOTE]ry of Cultural Affairs.
Dental Evidence from the Aterian Human Populations of Morocco
The Aterian and its place in the North African Middle Stone Age
Eleanor M.L. Scerri Centre for the Archaeology of Human Origins (CAHO), 65A Avenue Campus, University of Southampton, Southampton SO17 1BF, UK
Abstract
quote: The Aterian is a frequently cited manifestation of the Middle Stone Age (MSA) of North Africa, yet its character and meaning have remained largely opaque, as attention has focused almost exclusively on the typology of tanged, or pedunculated, lithics. Observations of technological similarities between the Aterian and other regional technocomplexes suggest that the Aterian should be considered within the wider context of the North African MSA and not as an isolated phenomenon. This paper critically reviews the meaning and history of research of the Aterian. This highlights a number of serious issues with definitions and interpretations of this technocomplex, ranging from a lack of definitional consensus to problems with the common view of the Aterian as a desert adaptation. Following this review, the paper presents the results of a quantitative study of six North African MSA assemblages (Aterian, Nubian Complex and MSA). Correspondence and Principal Components Analyses are applied, which suggest that the patterns of similarity and difference demonstrated do not simplistically correlate with traditional divisions between named industries. These similarity patterns are instead structured geographically and it is suggested that they reflect a population differentiation that cannot be explained by isolation and distance alone. Particular results include the apparent uniqueness of Haua Fteah compared to all the other assemblages and the observation that the Aterian in northeast Africa is more similar to the Nubian in that region than to the Aterian in the Maghreb. The study demonstrates the existence of population structure in the North African MSA, which has important implications for the evolutionary dynamics of modern human dispersals.
quote:Originally posted by xyyman: [QB] Tsk! Tsk Tsk! Are you listening to yourself?
Quote: "Many Copts are a shade of BROWN and LOOKED mixed". Ha! Ha!
Still don't get how nature/evolution works? I assumed your crew had a higher level of education maybe I am mistaken.
I will make it simply. How a person LOOK could be a result of (1) admixture or (2) they evolved to look that way. That is their natural look.
I covered (2) that I said "or intermediate"
Lioness,(since you have covered it) show info on the basal clade Hg H and it's frequencies. And a summation of the alleles.
It's you who posted those studies after all on Hg HV, H and V.
We have to get to the bottom of this. Like we have done with Hg M, M1 and U6.
Posts: 22234 | From: האם אינכם כילדי הכרית אלי בני ישראל | Registered: Nov 2010
| IP: Logged |
The Barbed Points (aqualithic) and Ounanian culture are both ancient indigenous African culture. According to the study, the Aqualithic African culture spread following the expansion of aquatic resources in the Holocene which made the Sahara attractive to populations with existing fishing and riverine hunting skills. The Ounanian culture (Niger-congo speakers) from North West Africa would have spread southward following big land animals with their bow and arrow hunting skills.
Posts: 2981 | Registered: Jan 2012
| IP: Logged |
The Barbed Points (aqualithic) and Ounanian culture are both ancient indigenous African culture. According to the study, the Aqualithic African culture spread following the expansion of aquatic resources in the Holocene which made the Sahara attractive to populations with existing fishing and riverine hunting skills. The Ounanian culture (Niger-congo speakers) from North West Africa would have spread southward following big land animals with their bow and arrow hunting skills.
The Barbed Points (aqualithic) and Ounanian culture are both ancient indigenous African culture. According to the study, the Aqualithic African culture spread following the expansion of aquatic resources in the Holocene which made the Sahara attractive to populations with existing fishing and riverine hunting skills. The Ounanian culture (Niger-congo speakers) from North West Africa would have spread southward following big land animals with their bow and arrow hunting skills.
Thank you. I actually have taken the link to the full document from your thread. I just took out the map and posted it here because it was very interesting.
Posts: 2981 | Registered: Jan 2012
| IP: Logged |
quote:Originally posted by zarahan- aka Enrique Cardova:
Then the studies Holocene period back-to-Africa conclusions stand in particular to coastal parts of North Africa
Posts: 42918 | From: , | Registered: Jan 2010
| IP: Logged |
Tukuler
multidisciplinary Black Scholar
Member # 19944
posted
quote:Originally posted by the lioness,:
PLOS Genetics 2012
Genomic Ancestry of North Africans Supports Back-to-Africa Migrations Brenna M. Henn
A chicken wrote this article I tell you a CHICKEN!!! Bawk-bawking around n peckin' at the keyboard.
[Smile now Brenna don't get mad. I'm just funnin'.]
Posts: 8179 | From: the Tekrur straddling Senegal & Mauritania | Registered: Dec 2011
| IP: Logged |
posted
One of the main drawback of this study is that it has chosen black African population that are really distant from Berber and North African population in the north. There's many indigenous black Africans population in North Africa living in the south of North African countries. Since they are closer to "coastal" North African population in the north of the country, they are more likely to share genetic relationship with them (admixture, origin, ancestry, etc). Why ignore the African Saharan population closer to "coastal" North African population to compare them with?
Also the dating is sketchy. It is based on a lot of assumptions and models which can fail to represent the actual situations. It is highly speculative.
That said, they still have taken DNA sample (SNP) from non black African North African people living in North Africa and they have compared them with samples from other people including the Middle East and West Africa (strangely skipping Saharans Africans in North Africa like mentioned above).
Here's 2 of their main conclusion taken from the study.
quote: In summary, although paleoanthropological evidence has established the ancient presence of anatomically modern humans in northern Africa prior to 60,000 ya [edit:indigenous black Africans], the simplest interpretation of our results is that the majority of ancestry in modern North Africans derives from populations outside of Africa , through at least two episodes of increased gene flow during the past 40,000 years [Figure 1, Figure 2, Figure 3].
So, non-black African population in North Africa comes from migrants outside Africa (postdating the Out of Africa migration movement).
quote: Conclusion
Our genome-wide dense genotyping data from seven North African populations allow us to address outstanding questions regarding the origin and migration history of North Africa. We propose that present-day [edit: non-black African] ancestry in North Africa is the result of at least three distinct episodes: ancient back-to-Africa gene flow prior to the Holocene, more recent gene flow from the Near East resulting in a longitudinal gradient, and limited but very recent migrations from sub-Saharan Africa. Population structure in North Africa is particularly complex, and future disease or phenotypic studies should carefully account for local demographic history.
Obviously they have hand picked non-black African North African population living close to the coast and they also ignored black African population much close to those population to compare their DNA with. That created a exaggerated distance between the North African population sampled and black African population in general. Sampled "coastal" North African populations are more likely to share DNA (thus ancestry) with black African population close to them than further away from them.
Posts: 2981 | Registered: Jan 2012
| IP: Logged |
posted
I cringe when I read some of the critiques of Henn et al 2012. What the hell does sampling have to do with the raw results? Aside of the fact that its patently false that no near Sahara folks have been sampled, there are only so many Ks in Africa, so throwing in more near Saharan populations will only result in more populations along a cline of the already identified Ks, as demonstrated by the Ks of the used near Saharan Fulani, Hausa and Bulala samples. I really hope to get some clarification, as to how proponents of this notion perceive sampling to have a notable effect on the observations made regarding the Maghrebi component and the other Ks.
Posts: 8785 | From: Discovery Channel's Mythbusters | Registered: Dec 2009
| IP: Logged |
posted
I am not sure I follow your point. Are you saying, as an example, if they sample Ottoman Turks living in Cairo vs . . .say...tribal peoples living in villages and desert of Egypt the genetic results won't be skewed?
Posts: 12143 | From: When you have eliminated the impossible, whatever remains, however improbable | Registered: Jun 2007
| IP: Logged |
posted
Skewed in this context I presume would mean steering the data either intentionally or unintentionally in an unsupported direction. I can see that playing a role where some of Henn et al 2012's interpretations of their data is concerned (e.g., the antiquity of Sub Saharan ancestry in North Africa, Egypt in particular), but how does it influence their raw results, unless you're willing to invoke fraud? What other Ks are likely left unturned in contemporary Northern Africa other than Nilo-Saharan, Afrasan, Chadic, Niger Congo, Omotic, European, Middle Eastern? Would more Saharan samples change the affinity of what Henn et al call ''Maghrebi ancestry'' from distant to Sub-Saharan Africa, to close to Sub-Saharan Africa, if so, why would Sub-Saharan samples not suffice? Are the remaining recent Middle Eastern, European and Sub Saharan components in Berbers not in keeping with other research? What exactly would be corrected with the inclusion of more Saharan samples?
Posts: 8785 | From: Discovery Channel's Mythbusters | Registered: Dec 2009
| IP: Logged |
quote:Originally posted by Swenet: I cringe when I read some of the critiques of Henn et al 2012. What the hell does sampling have to do with the raw results?
Raw results comes from sampling values obviously (the SNP alleles values). How can you say sampling got no impact of the raw results?
quote: Aside of the fact that its patently false that no near Sahara folks have been sampled, there are only so many Ks in Africa, so throwing in more near Saharan populations will only result in more populations along a cline of the already identified Ks, as demonstrated by the Ks of the used near Saharan Fulani, Hausa and Bulala samples.
That's ridiculous. Some probable Ks (population) have separated from other Africans in West Africa and Kenya (their used samples for the study) to stay (or settle) in North Africa and their DNA was excluded from the study.
Obviously, because their ancestry diverge at one point (West Africans and Kenyans have move away from the Sahara and North Africa to settle in West Africa and Kenya respectively ), black Africans in North Africa have many different SNP values (raw data) than West Africans like Fulani.
Their SNP values just weren't analyzed in the Henn study since they weren't part of the sampled populations.
What you do is like making conclusion about the ancestry of Finnish people (North African indigenous black population in our example) by using sample from Basque people (in eastern Europe) because they are all Europeans after all. Why skip the Finnish people, why skip the black Africans North Africans, if they are part of the people we would like to study?
Would you like that if they excluded coastal North Africans (of Western Asian ancestry) from the study only to study black Africans population who have settled on North Africa? (comparing them with populations from the Levant and beyond only)
This is a table of the the populations they used in the study:
Table S1: Details of the dataset used in the present study.
Population Sample Size Country Reference Morocco - North 18 Morocco Present study Morocco - South 16 Morocco Present study Saharawi 18 Western Sahara Present study Algerian 19 Algeria Present study Tunisian 18 Tunisia Present study Libyan 17 Libya Present study Egyptian 19 Egypt Present study Basques 20 Spain Present study Tuscans 26 Italy HapMap3 Qatari 30 Qatar Hunter-Zinck et al. 2010 Yoruba 26 Nigeria HapMap3 Hausa 12 Nigeria Bryc et al. 2010 Bulala 15 Nigeria Bryc et al. 2010 Fulani 12 Nigeria Bryc et al. 2010 Luhya 25 Kenya HapMap3 Maasai 30 Kenya HapMap3
African populations from Nigeria and Kenya. I'm surprised that this makes sense to you.
Posts: 2981 | Registered: Jan 2012
| IP: Logged |
quote:Raw results comes from sampling values obviously (the SNP alleles values).[quote] Now you're just talking out of your neck as always. SNPs aren't short tandem repeats, that they would comprise of ''values''. What exactly is your point? Of course raw results come from samples, but how exactly would inclusion of more populations affect the results? [quote]That's ridiculous. Some probable Ks (population)
As usual, you got it all jacked up. 'Ks' aren't populations.
quote:have separated from other Africans in West Africa and Kenya (their used samples for the study) to stay (or settle) in North Africa and their DNA was excluded from the study.
And that would affect the results in a major way, that you'd describe it as a drawback, how?
quote:What you do is like making conclusion about the ancestry of Finnish people (North African indigenous black population in our example) by using sample from Basque people (in eastern Europe) because they are all Europeans after all.
All the more evidence that you don't know how studies work or what a hypothesis is. The goal of the paper wasn't to map the affinities of African populations in general.
Posts: 8785 | From: Discovery Channel's Mythbusters | Registered: Dec 2009
| IP: Logged |
posted
Amun-Ra they found some early back migrations in North Africa. That doesn't mean every North African. You can't dismiss the whole study because it doesn't apply to all North Africans. It applies to the ones they are talking about
Posts: 42918 | From: , | Registered: Jan 2010
| IP: Logged |
quote:Raw results comes from sampling values obviously (the SNP alleles values).[quote] Now you're just talking out of your neck as always. SNPs aren't short tandem repeats, that they would comprise of ''values''. What exactly is your point? Of course raw results come from samples, but how exactly would inclusion of more populations affect the results? [quote]That's ridiculous. Some probable Ks (population)
As usual, you got it all jacked up. 'Ks' aren't populations.
quote:have separated from other Africans in West Africa and Kenya (their used samples for the study) to stay (or settle) in North Africa and their DNA was excluded from the study.
And that would affect the results in a major way, that you'd describe it as a drawback, how?
quote:What you do is like making conclusion about the ancestry of Finnish people (North African indigenous black population in our example) by using sample from Basque people (in eastern Europe) because they are all Europeans after all.
All the more evidence that you don't know how studies work or what a hypothesis is. The goal of the paper wasn't to map the affinities of African populations in general.
I find those studies interesting but you did a good job avoiding all my main points and blowing some air. For a guy who says sampling got no impact of the raw results, I would take it with a grain of salt. (Ks are indeed "postulated ancestral populations" btw).
It is true that the goal of the paper wasn't to map the Affinities of African populations in North Africa (it didn't even have their DNA) that's why it's surprising to see the study make reference to them (for example, saying "North African populations are distinct from sub-Saharan Africans"). That's the quote from the first line of the study.
For example, it's possible that some Berber (or other coastal North African groups) share more affinities (SNP alleles values) with black Africans groups close to them geographically but much less with Nigerians or Kenyans.
Also the North African population include indigenous black African population (usually in the south of those countries), how is it possible for them to say "North African populations are distinct from sub-Saharan Africans" then make discussion/conclusion about that subject? It's like saying coastal North African populations got limited affinities with South African population. It's obvious they got more affinities (SNP allele value shared) with black African population close to them geographically.
Posts: 2981 | Registered: Jan 2012
| IP: Logged |
quote:Originally posted by the lioness,: Amun-Ra they found some early back migrations in North Africa. That doesn't mean every North African. You can't dismiss the whole study because it doesn't apply to all North Africans. It applies to the ones they are talking about
That's what I said earlier on this thread. But the study goes beyond that and make some reference (conclusion) about the relationship between current coastal North Africans and black Africans (called Sub-Saharan Africans in the study, a bit of a misnomer). Like if every "sub-saharan Africans" were Nigerians or Kenyans and had similar SNP values to them. For a population study it's strange that the study avoid an important part of the population which are part of the genetic make up of the region.
Posts: 2981 | Registered: Jan 2012
| IP: Logged |
posted
Indeed. The sampling is primarily coastal, and thus will skew results. Its like those studies that sample the far north of Egypt and use the data as "representative" of Egypt as a whole. Its a game some researchers run time and time again. It's a problem specifically noted in the literature re "North Africa."
And "North Africa" is a place with a very wide range not merely the coast:
Posts: 5905 | From: The Hammer | Registered: Aug 2008
| IP: Logged |
quote:Originally posted by zarahan- aka Enrique Cardova: [QB] Indeed. The sampling is primarily coastal, and thus will skew results. Its like those studies that sample the far north of Egypt and use the data as "representative" of Egypt as a whole. Its a game some researchers run time and time again. It's a problem specifically noted in the literature re "North Africa."
That doesn't mean in part of North Africa there was not back-to-Africa gene flow more than 12,000 years ago. That is pretty far back much earlier than records for Phoenicians/Sea people.
Posts: 42918 | From: , | Registered: Jan 2010
| IP: Logged |
quote:Originally posted by the lioness,: Amun-Ra they found some early back migrations in North Africa. That doesn't mean every North African. You can't dismiss the whole study because it doesn't apply to all North Africans. It applies to the ones they are talking about
Who are the ones they are "talking about"?
Posts: 22234 | From: האם אינכם כילדי הכרית אלי בני ישראל | Registered: Nov 2010
| IP: Logged |
quote:Originally posted by the lioness,: Amun-Ra they found some early back migrations in North Africa. That doesn't mean every North African. You can't dismiss the whole study because it doesn't apply to all North Africans. It applies to the ones they are talking about
Who are the ones they are "talking about"?
the people listed. samples near coast
Posts: 42918 | From: , | Registered: Jan 2010
| IP: Logged |
quote: Originally posted by Amun-Ra The Ultimate: and blowing some air.
Yeah, like equating a SNP with a STR, or referring to Ks as ''populations''.
quote:For a guy who says sampling got no impact of the raw results
My reference to the low impact of sampling was obviously meant as in sampling more populations than they already have. But taking stuff horribly out of context is what you're known for here on ES.
quote:(Ks are indeed "postulated ancestral populations" btw).
You have absolutely no idea what you're talking about. Its literally oozing from everything you say. And I'm not just talking this thread.
quote:that's why it's surprising to see the study make reference to them (for example, saying "North African populations are distinct from sub-Saharan Africans").
And that they're referring to the under-sampled Saharan proper populations when they say that, is evidenced by what?
quote:For example, it's possible that some Berber (or other coastal North African groups) share more affinities (SNP alleles values) with black Africans groups close to them geographically but much less with Nigerians or Kenyans.
You're too much of an ignoramus to have noticed that both the Fulani, Hausa and Bulala samples qualify for what you're stating above. The very populations you go at lengths to say weren't sampled, are actually sampled, as I've tried to point out earlier (but, to no avail).
quote:share more affinities (SNP alleles values)
LMAO at ''SNP alleles values'', when the 'S' in SNP means SINGLE. Does ''single'' strike you as compatible with values? You're a walking caricature, not to be taken serious, not even by the Euronut trolls.
quote:Also the North African population include indigenous black African population (usually in the south of those countries)
Again, you simply don't understand what you're discussing. The Fulani, Hausa and Bulala already qualify for what you're stating above.
Posts: 8785 | From: Discovery Channel's Mythbusters | Registered: Dec 2009
| IP: Logged |
quote: Originally posted by Amun-Ra The Ultimate: and blowing some air.
Yeah, like equating a SNP with a STR, or referring to Ks as ''populations''.
quote:For a guy who says sampling got no impact of the raw results
My reference to the low impact of sampling was obviously meant as in sampling more populations than they already have. But taking stuff horribly out of context is what you're known for here on ES.
quote:(Ks are indeed "postulated ancestral populations" btw).
You have absolutely no idea what you're talking about. Its literally oozing from everything you say. And I'm not just talking this thread.
quote:that's why it's surprising to see the study make reference to them (for example, saying "North African populations are distinct from sub-Saharan Africans").
And that they're referring to the under-sampled Saharan proper populations when they say that, is evidenced by what?
quote:For example, it's possible that some Berber (or other coastal North African groups) share more affinities (SNP alleles values) with black Africans groups close to them geographically but much less with Nigerians or Kenyans.
You're too much of an ignoramus to have noticed that both the Fulani, Hausa and Bulala samples qualify for what you're stating above. The very populations you go at lengths to say weren't sampled, are actually sampled, as I've tried to point out earlier (but, to no avail).
quote:share more affinities (SNP alleles values)
LMAO at ''SNP alleles values'', when the 'S' in SNP means SINGLE. Does ''single'' strike you as compatible with values? You're a walking caricature, not to be taken serious, not even by the Euronut trolls.
quote:Also the North African population include indigenous black African population (usually in the south of those countries)
Again, you simply don't understand what you're discussing. The Fulani, Hausa and Bulala already qualify for what you're stating above.
You say I'm wrong but you give no explanation why. We suppose to believe you without explanations? Let's exchange information not hot air.
1) Nigerian and Kenyan populations are not the same than black African in North Africa. They have different SNP DNA values. They are more likely to have interacted other people in North Africa since they are geographically closer and are more likely to share DNA with them (among other thing).
2)Even if SNPs are *single* nucleotide polymorphism they still have different alleles values that's why we're making the study. The values correspond to the different nucleotides it could have (A, T, C or G). Obviously, there must be at least 2 different alleles values in a population to be considered an SNP.
At a single site on the DNA strand people (a population) can have many different allele values depending on their ancestry (or mutation). In fact each person can even have 2 values at the same site (one in each chromosome passed from the mother and the father).
This is from Wiki: For example, two sequenced DNA fragments from different individuals, AAGCCTA to AAGCTTA, contain a difference in a single nucleotide. In this case we say that there are two alleles.
That's pretty basic, it's funny you don't understand that. You're the one making a fool out of yourself you will pardon me to say.
3) If you don't consider Ks "postulated ancestral populations" then I want to know what do you consider the Ks are?
Posts: 2981 | Registered: Jan 2012
| IP: Logged |
posted
Question: I wonder if Rameses III, who is E1b1a, has this so called Euroasian SNPs? wink! wink! Posts: 12143 | From: When you have eliminated the impossible, whatever remains, however improbable | Registered: Jun 2007
| IP: Logged |
West African(negros) were new to Africa ie of Asian ancestry. - proven wrong!!
AfroAsian language originated in EurAsia,- Proven Wrong!!
E1b1b orginated in Eurasia - proven wrong!!
M1 was Eurasian- proven wrong!!!
U6 Was Eurasian - proven worng!!
AEian culturally came from Eurasia - proven wrong!!
what's next. ...SNPs?
Remember STR proves Berbers are indigenous Africans.
Selective SNPs is the lastest tool used to carve out North Africa from Africa. Posts: 12143 | From: When you have eliminated the impossible, whatever remains, however improbable | Registered: Jun 2007
| IP: Logged |
quote:Originally posted by the lioness,: Amun-Ra they found some early back migrations in North Africa. That doesn't mean every North African. You can't dismiss the whole study because it doesn't apply to all North Africans. It applies to the ones they are talking about
That's what I said earlier on this thread. But the study goes beyond that and make some reference (conclusion) about the relationship between current coastal North Africans and black Africans (called Sub-Saharan Africans in the study, a bit of a misnomer). Like if every "sub-saharan Africans" were Nigerians or Kenyans and had similar SNP values to them. For a population study it's strange that the study avoid an important part of the population which are part of the genetic make up of the region.
It isn't strange. They are doing it on purpose to fool those who don't know better into believing they aren't biased..... But common sense says that if you can see they skipped over a big chunk of the population and I can see it and we aren't scientists, then of course they could see it as well. In their minds North Africa is supposed to be for white folks and any blacks there came as slaves recently. This the same bull crap they have been saying for the last 100 years or more and we know why.
Posts: 8889 | Registered: May 2005
| IP: Logged |
posted
Why are twisting my words. I am not annoyed just amused.
I said LIGHT skin is indigenous to parts of Africa.
R1b1ba2(R-M269) is NOT.
E1b1b* and it's siblings are.
Look at the Global UV Map. Look at indigenous peoples skin color during the early 1900's. Read Sergi etc Read books by travelers from the 1600s to 1900s.
Put it together and tell me what you come up with...clown.
Is Zidane a Berber? Your point of the picture? He could be an Ottoman Turk claiming to be a Berber. What is his STRs. What is his limb proportion? WHat is his eye color? What is his Hg-Lineage? What is his family history?
If you don't know...get rid of the pic. Ha! Ha!
Posts: 12143 | From: When you have eliminated the impossible, whatever remains, however improbable | Registered: Jun 2007
| IP: Logged |


 UBBFriend: Email this page to someone!


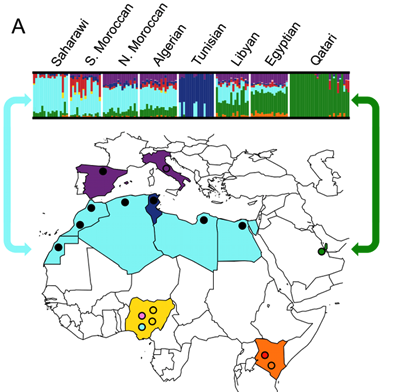
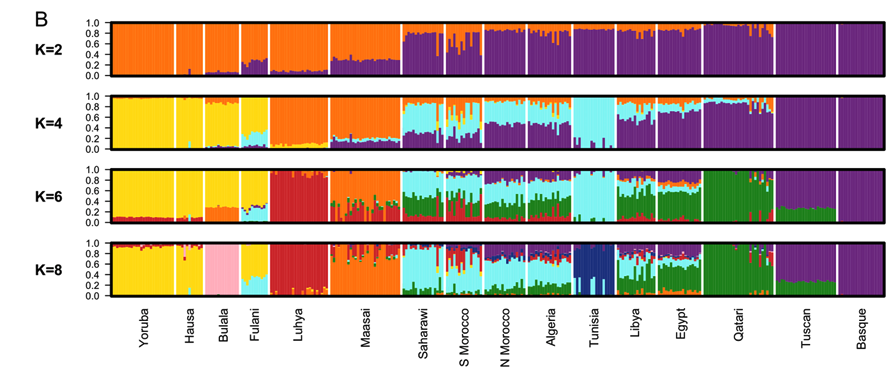
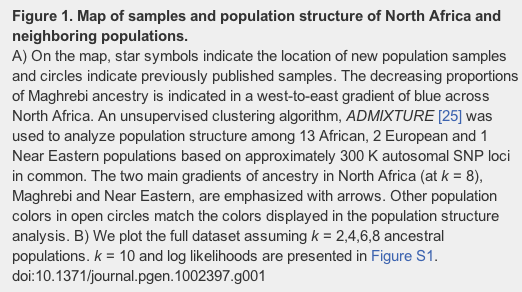
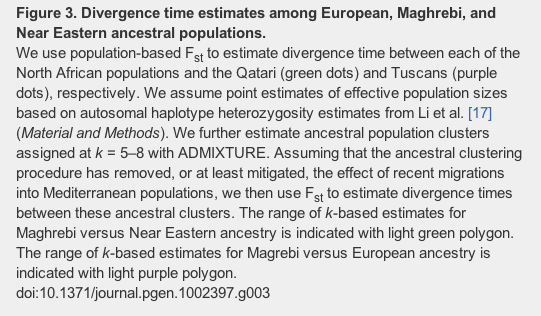
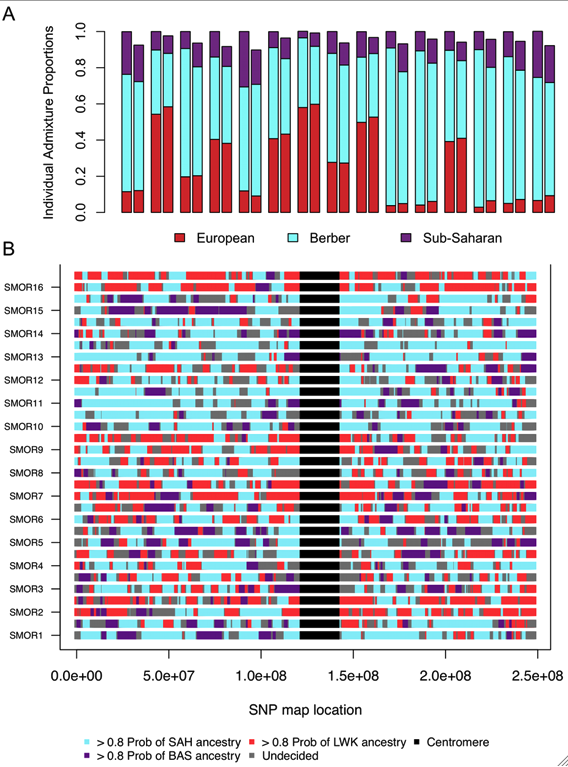


![[Big Grin]](biggrin.gif)
![[Roll Eyes]](rolleyes.gif)
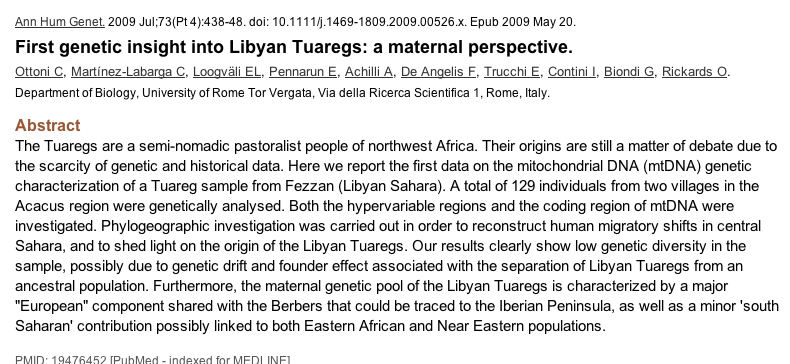
 The above-mentioned studies have thus revealed a dual influence in the genetic make-up of this African people. In this study, we provide new mtDNA and Y chromosome data sets of three unrelated Tuareg groups from three different countries (Niger, Mali and Burkina Faso). At the same time, we try to unravel the questions of their genetic origin, the mutual relationships among their sub-populations as well as possible links to neighbouring populations. The genetic heritage of the Tuareg population is analysed within the context of the West Eurasian versus sub-Saharan contributions to their gene pool.
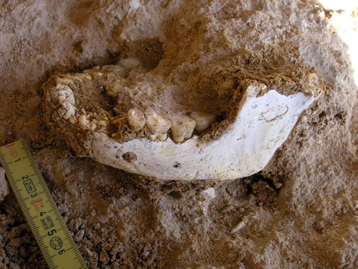
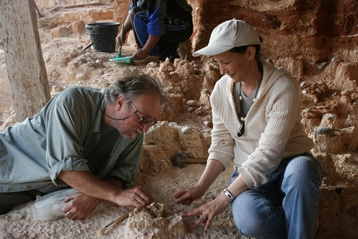
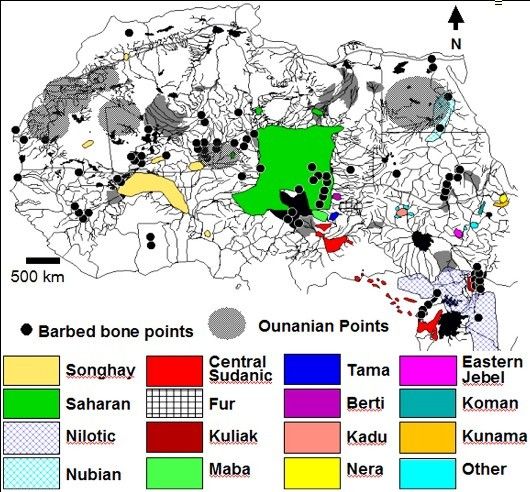


 Printer-friendly view of this topic